Probability Diagrams - Venn & Tree Diagrams
1. In a survey, 60 students were asked whether they have a bank account (B) and whether they have a part-time job (J).
The number of students who had neither a bank account nor a part-time job was x.
The Venn diagram shows the results in terms of x.
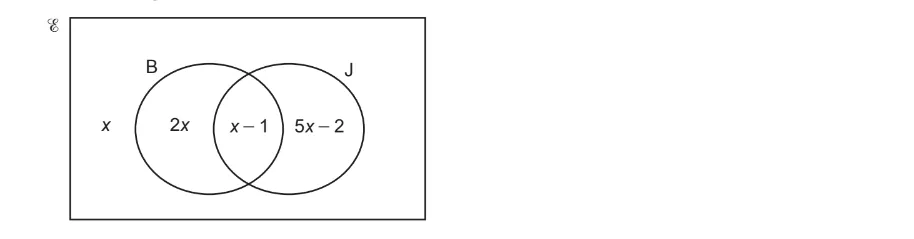
One of the 60 students is chosen at random. Find the probability that they have a bank account. Show your working.

Ai এর মাধ্যমে

১০ লক্ষ+ প্রশ্ন ডাটাবেজ

প্র্যাকটিস এর মাধ্যমে নিজেকে তৈরি করে ফেলো
উত্তর দিবে তোমার বই থেকে ও তোমার মত করে।

সারা দেশের শিক্ষার্থীদের মধ্যে নিজের অবস্থান যাচাই
No related questions found

