Probability Diagrams - Venn & Tree Diagrams
1. This question has 2 part(s).
1.1. A skills test has two sections, literacy (L) and numeracy (N).
One day everyone who took the skills test passed at least one section.
88% passed the literacy section and 76% passed the numeracy section.
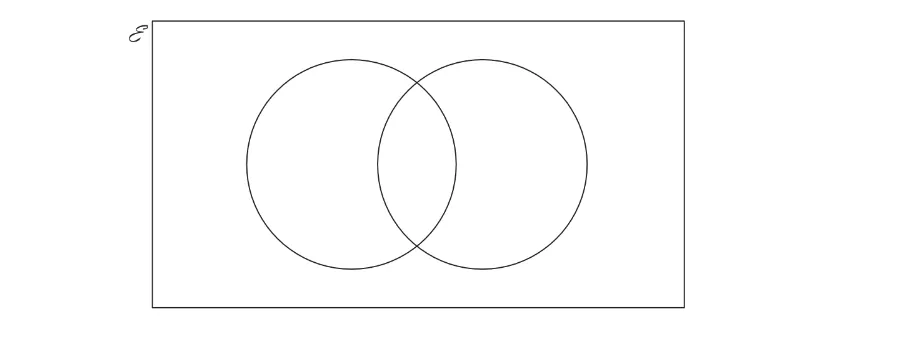
Represent this information on a Venn diagram.
Show clearly the percentage in each section of the diagram.
1.2. One person is chosen at random from all the people who took the skills test that day.
What is the probability that this person
i) passed the numeracy section, given that they passed the literacy section,
[2]
ii) passed the literacy section, given that they passed only one section?
[2]

Ai এর মাধ্যমে

১০ লক্ষ+ প্রশ্ন ডাটাবেজ

প্র্যাকটিস এর মাধ্যমে নিজেকে তৈরি করে ফেলো
উত্তর দিবে তোমার বই থেকে ও তোমার মত করে।

সারা দেশের শিক্ষার্থীদের মধ্যে নিজের অবস্থান যাচাই
No related questions found

