Economic Activity & Energy Enquiry Skills
1. This question has 2 part(s).
1.1. Describe the factors to be considered in preparing a questionnaire.
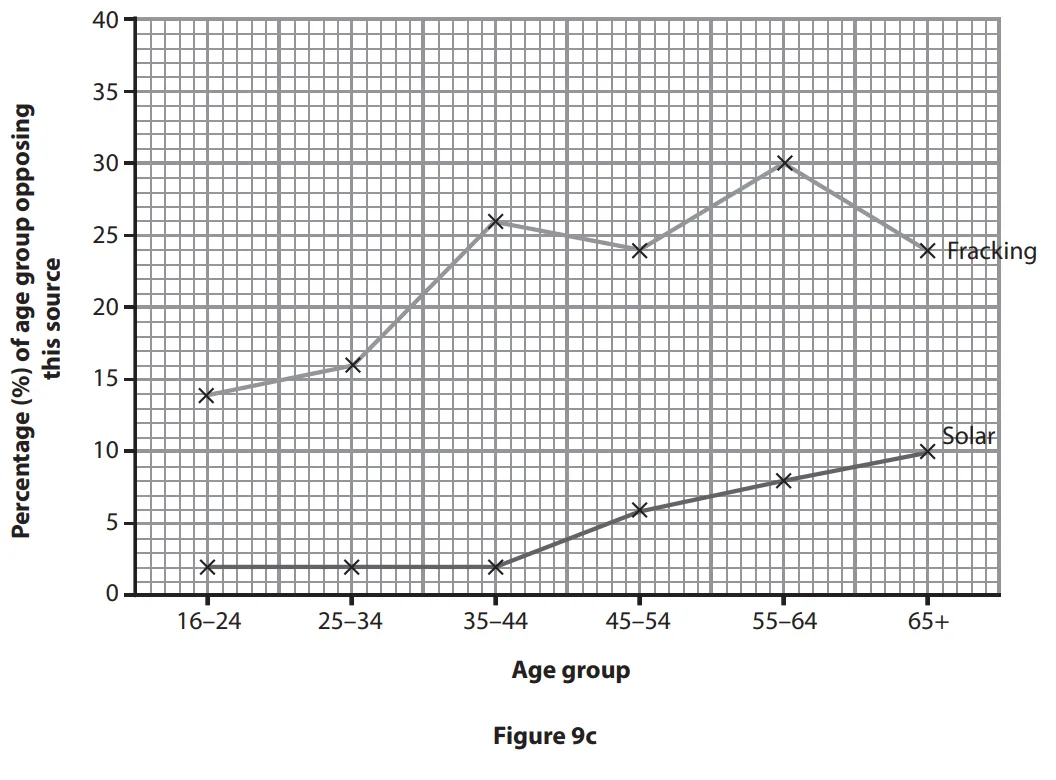
1.2. (i) Study Figure 9b which shows some results of a survey about the use of four energy sources.
Justify the technique used in Figure 9c to represent the results shown in Figure 9b.
Age Group | Percentage (%) of age group opposing this source | |||
|---|---|---|---|---|
Nuclear | Onshore wind | Solar | Fracking* | |
16-24 | 26 | 5 | 2 | 14 |
25–34 | 20 | 4 | 2 | 16 |
35–44 | 25 | 5 | 2 | 26 |
45–54 | 37 | 10 | 6 | 24 |
55–64 | 26 | 16 | 8 | 30 |
65+ | 21 | 20 | 10 | 24 |
*gas from underground rocks
Figure 9b
(3)
(ii) Suggest additional information that might be collected to improve this investigation.
(3)

Ai এর মাধ্যমে

১০ লক্ষ+ প্রশ্ন ডাটাবেজ

প্র্যাকটিস এর মাধ্যমে নিজেকে তৈরি করে ফেলো
উত্তর দিবে তোমার বই থেকে ও তোমার মত করে।

সারা দেশের শিক্ষার্থীদের মধ্যে নিজের অবস্থান যাচাই
No related questions found

