Statistical Diagrams
1. This question has 2 part(s).
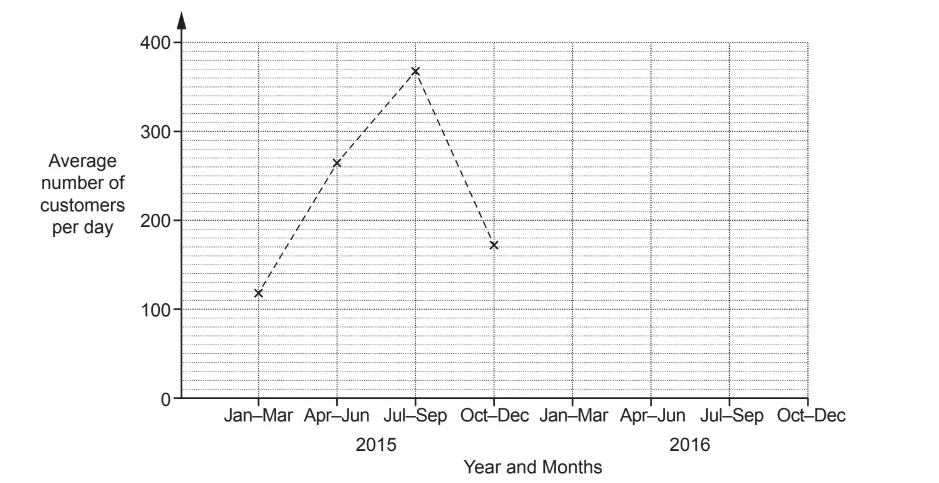
1.1. The table shows the average number of customers per day entering a shop.
2015 | 2016 | |||||||
Months | Jan- Mar | Apr- Jun | July- Sep | Oct- Dec | Jan- Mar | Apr- Jun | July- Sep | Oct- Dec |
Average number of customers per day | 119 | 264 | 368 | 172 | 130 | 304 | 381 | 192 |
Complete the time series graph below.
1.2. Make two different comments comparing the number of customers entering the shop in 2015 and 2016.

Ai এর মাধ্যমে

১০ লক্ষ+ প্রশ্ন ডাটাবেজ

প্র্যাকটিস এর মাধ্যমে নিজেকে তৈরি করে ফেলো
উত্তর দিবে তোমার বই থেকে ও তোমার মত করে।

সারা দেশের শিক্ষার্থীদের মধ্যে নিজের অবস্থান যাচাই
No related questions found

