Physics on the Move
1. This question has 3 part(s).
1.1. The table below shows the stopping distances for a car.
Speed of car (m/s) | Thinking distance (m) | Braking distance (m) | Total stopping distance (m) |
8 | 6 | 6 | 12 |
16 | 12 | 24 | |
32 | 96 | 120 |
Analyse the data in the table and use it to describe the trends shown.
Suggest reasons for the differences in the patterns in the data.
1.2. The car takes 6 m to brake when moving at 8 m/s.
Look at the graph of a car travelling at 8 m/s, starting to brake and then stopping.
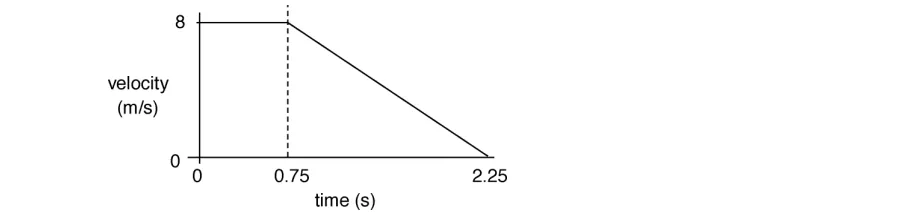
i) Calculate the acceleration of the car during braking.
Show your working and state the units.
Answer = ......................... Unit = .......... [4]
ii) The car has a braking force of 5000 N.
Calculate the work done by the brakes on the car.
Answer = ......................... J [2]
1.3. How is the braking distance affected if a driver is tired?
Explain your answer.

Ai এর মাধ্যমে

১০ লক্ষ+ প্রশ্ন ডাটাবেজ

প্র্যাকটিস এর মাধ্যমে নিজেকে তৈরি করে ফেলো
উত্তর দিবে তোমার বই থেকে ও তোমার মত করে।

সারা দেশের শিক্ষার্থীদের মধ্যে নিজের অবস্থান যাচাই
No related questions found

