Cumulative Frequency
1. This question has 3 part(s).
1.1. The grouped frequency table gives information about the times, in minutes, that office workers take to get to work.
Time ( minutes) | Frequency |
0</p></td><td><p style="line-height: 1.7" class="text-lg tracking-wide font-normal leading-relaxed">\(5 | |
20</p></td><td><p style="line-height: 1.7" class="text-lg tracking-wide font-normal leading-relaxed">\(30 | |
40</p></td><td><p style="line-height: 1.7" class="text-lg tracking-wide font-normal leading-relaxed">\(20 | |
60</p></td><td><p style="line-height: 1.7" class="text-lg tracking-wide font-normal leading-relaxed">\(15 | |
80</p></td><td><p style="line-height: 1.7" class="text-lg tracking-wide font-normal leading-relaxed">\(8 | |
100</p></td><td><p style="line-height: 1.7" class="text-lg tracking-wide font-normal leading-relaxed">\(2 |
Complete the cumulative frequency table.
Time ( minutes) | Cumulative frequency |
\(0 | |
\(0 | |
\(0 | |
\(0 | |
\(0 | |
\(0 |
1.2. On the grid, draw the cumulative frequency graph for this information.
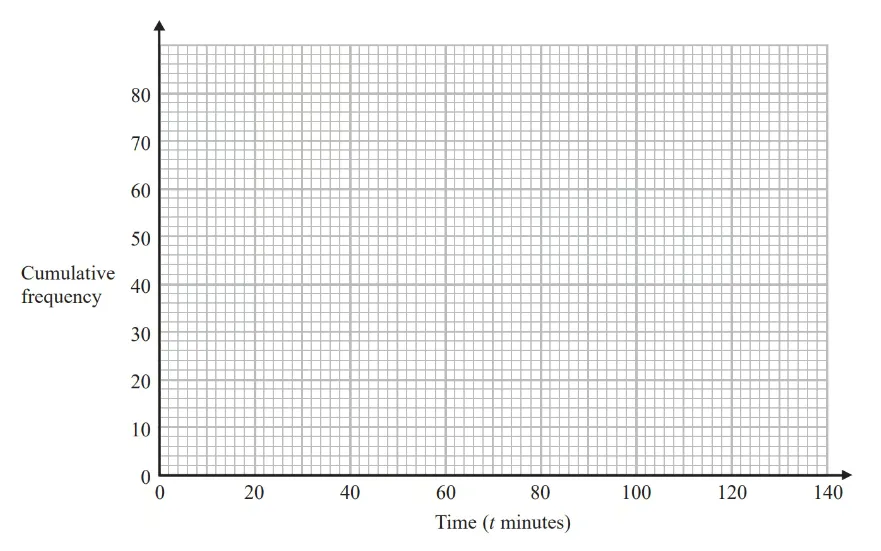
1.3. Use your graph to find an estimate for the percentage of these office workers who take more than minutes to get to work.

Ai এর মাধ্যমে

১০ লক্ষ+ প্রশ্ন ডাটাবেজ

প্র্যাকটিস এর মাধ্যমে নিজেকে তৈরি করে ফেলো
উত্তর দিবে তোমার বই থেকে ও তোমার মত করে।

সারা দেশের শিক্ষার্থীদের মধ্যে নিজের অবস্থান যাচাই
No related questions found

