Data Presentation
1. To quality control the elasticity of elastic bands, a company selects random elastic bands from the end of their production line and has a machine stretch them until they snap. The length, measured in millimetres, of an elastic band at the moment it snaps is recorded. The incomplete histogram and frequency table below show the results.
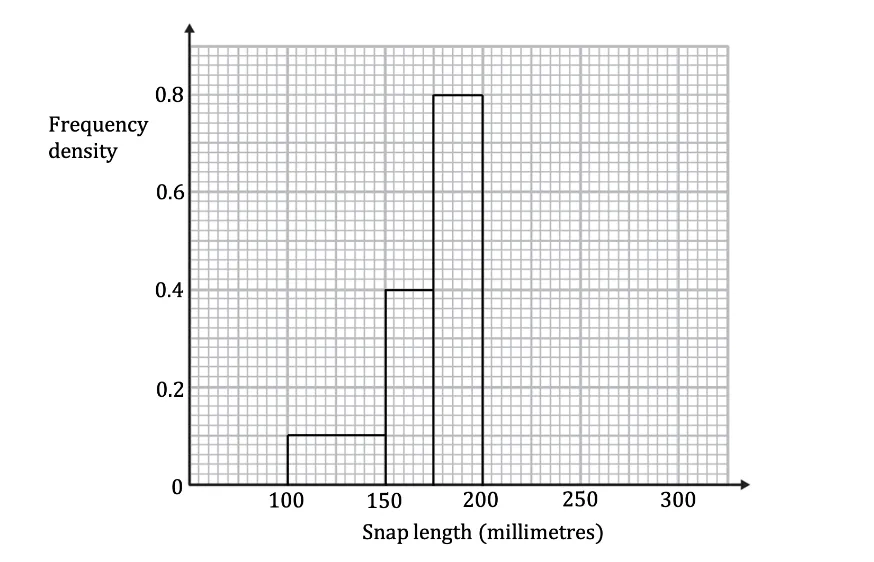
Snap length, l (mm) | Frequency | Class width | Frequency density |
|---|---|---|---|
100 ≤ l <150 | 5 | 150 - 100 = 50 | 5÷50=0.1 |
150 ≤ l <175 | ÷25=0.4 | ||
175 ≤ l <200 | |||
200 ≤ l < 225 | 15 | 225 - 200 = 25 | |
225 ≤ l <275 | 10 |
Use the information to complete both the histogram and frequency table.

Ai এর মাধ্যমে

১০ লক্ষ+ প্রশ্ন ডাটাবেজ

প্র্যাকটিস এর মাধ্যমে নিজেকে তৈরি করে ফেলো
উত্তর দিবে তোমার বই থেকে ও তোমার মত করে।

সারা দেশের শিক্ষার্থীদের মধ্যে নিজের অবস্থান যাচাই
No related questions found

