Working with Data
1. This question has 4 part(s).
1.1. As part of an experiment, 15 maths teachers are asked to solve a riddle and their times, in minutes, are recorded:
8 | 12 | 19 | 20 | 20 |
21 | 22 | 23 | 23 | 23 |
25 | 26 | 27 | 37 | 39 |
An outlier is an observation which lies more than ± 2 standard deviations away from the mean.
Show that there is exactly one outlier.
1.2. State, with a reason, whether the mean or the median would be the most suitable measure of central tendency for these data.
1.3. 15 history teachers also completed the riddle; their times are shown below in the box plot:
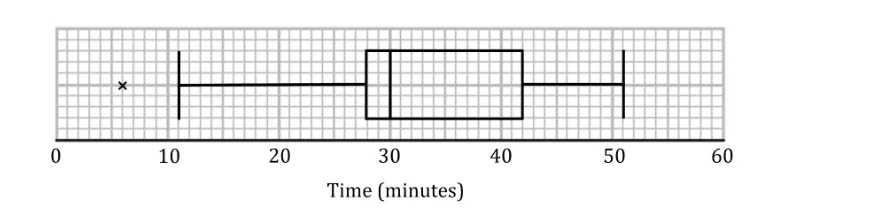
Explain what the cross (×) represents on the box plot above. Interpret this in context.
1.4. By comparing the distributions of times taken to complete the riddle, decide which set of teachers were faster at solving the riddle.

Ai এর মাধ্যমে

১০ লক্ষ+ প্রশ্ন ডাটাবেজ

প্র্যাকটিস এর মাধ্যমে নিজেকে তৈরি করে ফেলো
উত্তর দিবে তোমার বই থেকে ও তোমার মত করে।

সারা দেশের শিক্ষার্থীদের মধ্যে নিজের অবস্থান যাচাই
No related questions found

