Statistical Diagrams
1. This question has 4 part(s).
1.1. 80 students each record the name of their mathematics teacher. The number of these students taught by Mr House and by Miss Patel are shown in the bar chart.
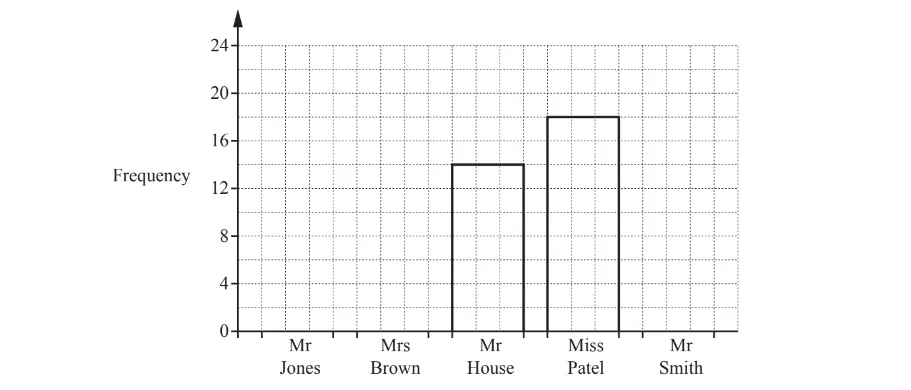
How many more students are taught by Miss Patel than by Mr House?
1.2. 15 students are taught by Mr Smith.
Twice as many students are taught by Mrs Brown than by Mr Jones.
Use this information to complete the bar chart.
1.3. Write down the mode.
1.4. This information is also to be shown in a pie chart.
Work out the sector angle for Miss Patel.

Ai এর মাধ্যমে

১০ লক্ষ+ প্রশ্ন ডাটাবেজ

প্র্যাকটিস এর মাধ্যমে নিজেকে তৈরি করে ফেলো
উত্তর দিবে তোমার বই থেকে ও তোমার মত করে।

সারা দেশের শিক্ষার্থীদের মধ্যে নিজের অবস্থান যাচাই
No related questions found

