2.6 Price Changes
1. The diagram shows the global market for copper with an equilibrium point of X.
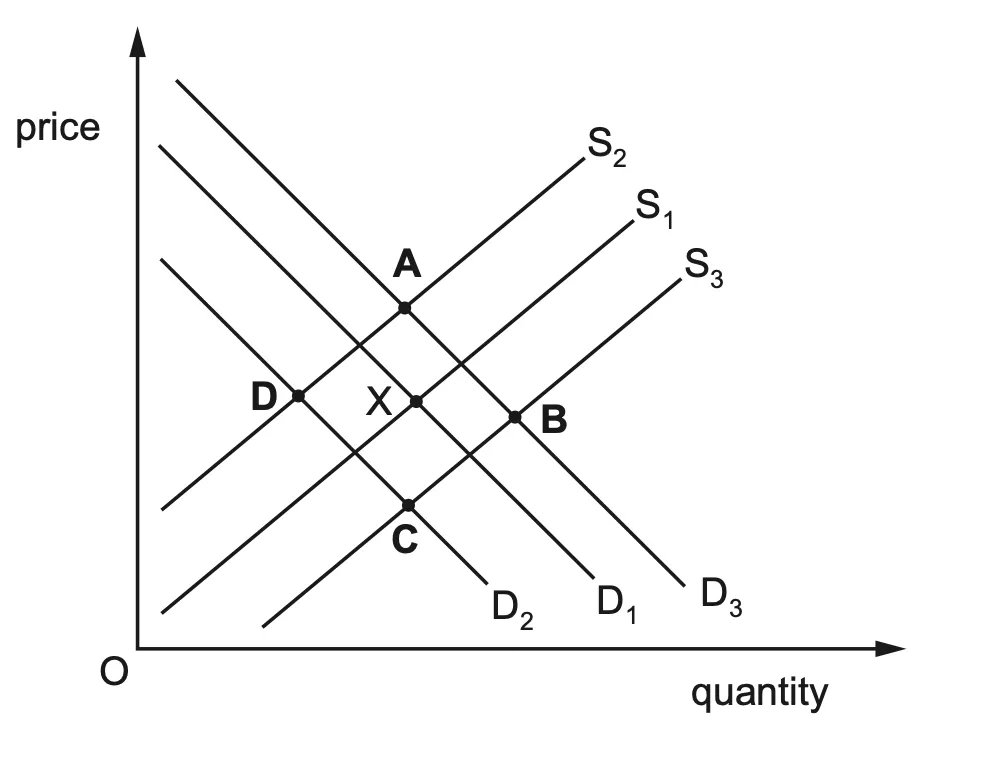
Which point represents the new equilibrium after the copper producers’ costs increase and there is rapid global economic growth?

Ai এর মাধ্যমে

১০ লক্ষ+ প্রশ্ন ডাটাবেজ

প্র্যাকটিস এর মাধ্যমে নিজেকে তৈরি করে ফেলো
উত্তর দিবে তোমার বই থেকে ও তোমার মত করে।

সারা দেশের শিক্ষার্থীদের মধ্যে নিজের অবস্থান যাচাই
No related questions found

