Practical Skills: Written Assessment
1. The graph below shows data collected from an investigation into the effect of different concentrations of ethanol on cell membrane permeability in samples of beetroot tissue.
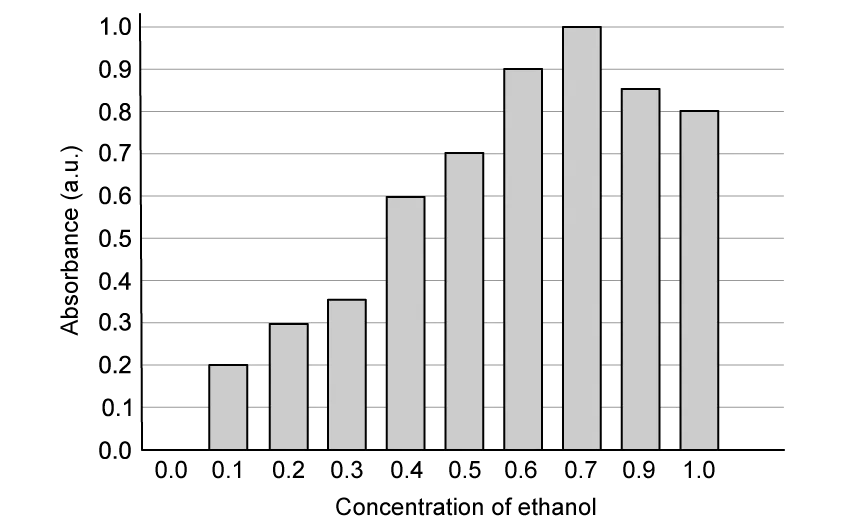
Which of the following statements provide an explanation for the data in the graph?
1 | Ethanol has increased the pH across the cell surface membrane, increasing its permeability. |
2 | Ethanol has dissolved cholesterol in the cell surface membrane, increasing its permeability. |
3 | Ethanol has denatured the proteins in the cell surface membrane, increasing its permeability. |
4 | Ethanol has dissolved phospholipids in the cell surface membrane, increasing its permeability. |

Ai এর মাধ্যমে

১০ লক্ষ+ প্রশ্ন ডাটাবেজ

প্র্যাকটিস এর মাধ্যমে নিজেকে তৈরি করে ফেলো
উত্তর দিবে তোমার বই থেকে ও তোমার মত করে।

সারা দেশের শিক্ষার্থীদের মধ্যে নিজের অবস্থান যাচাই
No related questions found

