Real-Life Graphs
1. Here is a speed-time graph for a car journey.
The journey took 100 seconds.
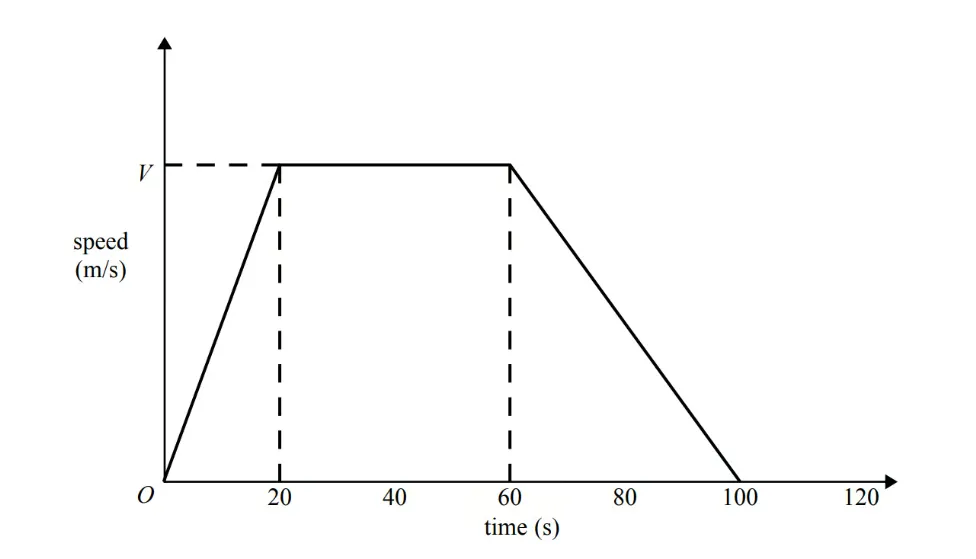
The car travelled 1.75km in the 100 seconds.
Work out the value of .

Ai এর মাধ্যমে

১০ লক্ষ+ প্রশ্ন ডাটাবেজ

প্র্যাকটিস এর মাধ্যমে নিজেকে তৈরি করে ফেলো
উত্তর দিবে তোমার বই থেকে ও তোমার মত করে।

সারা দেশের শিক্ষার্থীদের মধ্যে নিজের অবস্থান যাচাই
No related questions found

