Planning & Types of Data
1. This question has 4 part(s).
1.1. Some researchers investigated the hand span, in centimetres, of adult pianists by their level – international, national and amateur.
The box plots below give information about the hand spans for national level and amateur level pianists.
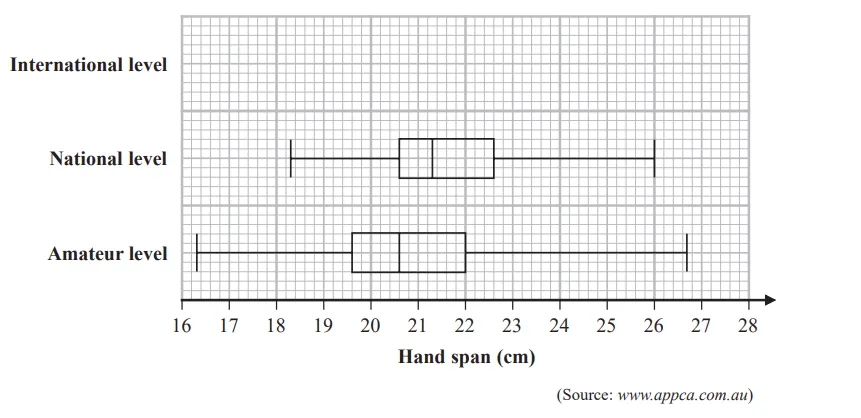
Circle the word in the list below that describes hand span, in centimetres, as a type of data.
qualitative ordinal continuous bivariate
1.2. The table gives information about the hand spans of the international level pianists.
Greatest hand span | 27.4 cm |
Median hand span | 23.9 cm |
Lower quartile | 23.2 cm |
Range | 5.1 cm |
Interquartile range | 1.1 cm |
Using the information in the table, draw on the grid above a box plot for the hand spans of the international level pianists.
1.3. Compare the three distributions of hand spans.
Give three comparisons and interpret two of your comparisons.
1.4. Pavel owns a music shop.
He wants to investigate the keyboard sizes used by pianists with different hand spans.
He collects data about the hand spans of the pianists who use his shop.
The table gives information about the number of these pianists with hand spans in each of four size categories.
Hand span (cm) | A | B | C | D |
|---|---|---|---|---|
Number of pianists | 24 | 65 | 57 | 14 |
Pavel plans to sample 20 of these pianists stratified by hand span size.
Explain how Pavel can obtain his stratified sample.
You should include details of any calculations he should use.

Ai এর মাধ্যমে

১০ লক্ষ+ প্রশ্ন ডাটাবেজ

প্র্যাকটিস এর মাধ্যমে নিজেকে তৈরি করে ফেলো
উত্তর দিবে তোমার বই থেকে ও তোমার মত করে।

সারা দেশের শিক্ষার্থীদের মধ্যে নিজের অবস্থান যাচাই
No related questions found

