Tabulation, Diagrams & Representation
1. This question has 3 part(s).
1.1. The pie charts show information about the numbers of children who trained in different sports activities at a summer activity camp in 2023 and 2024.
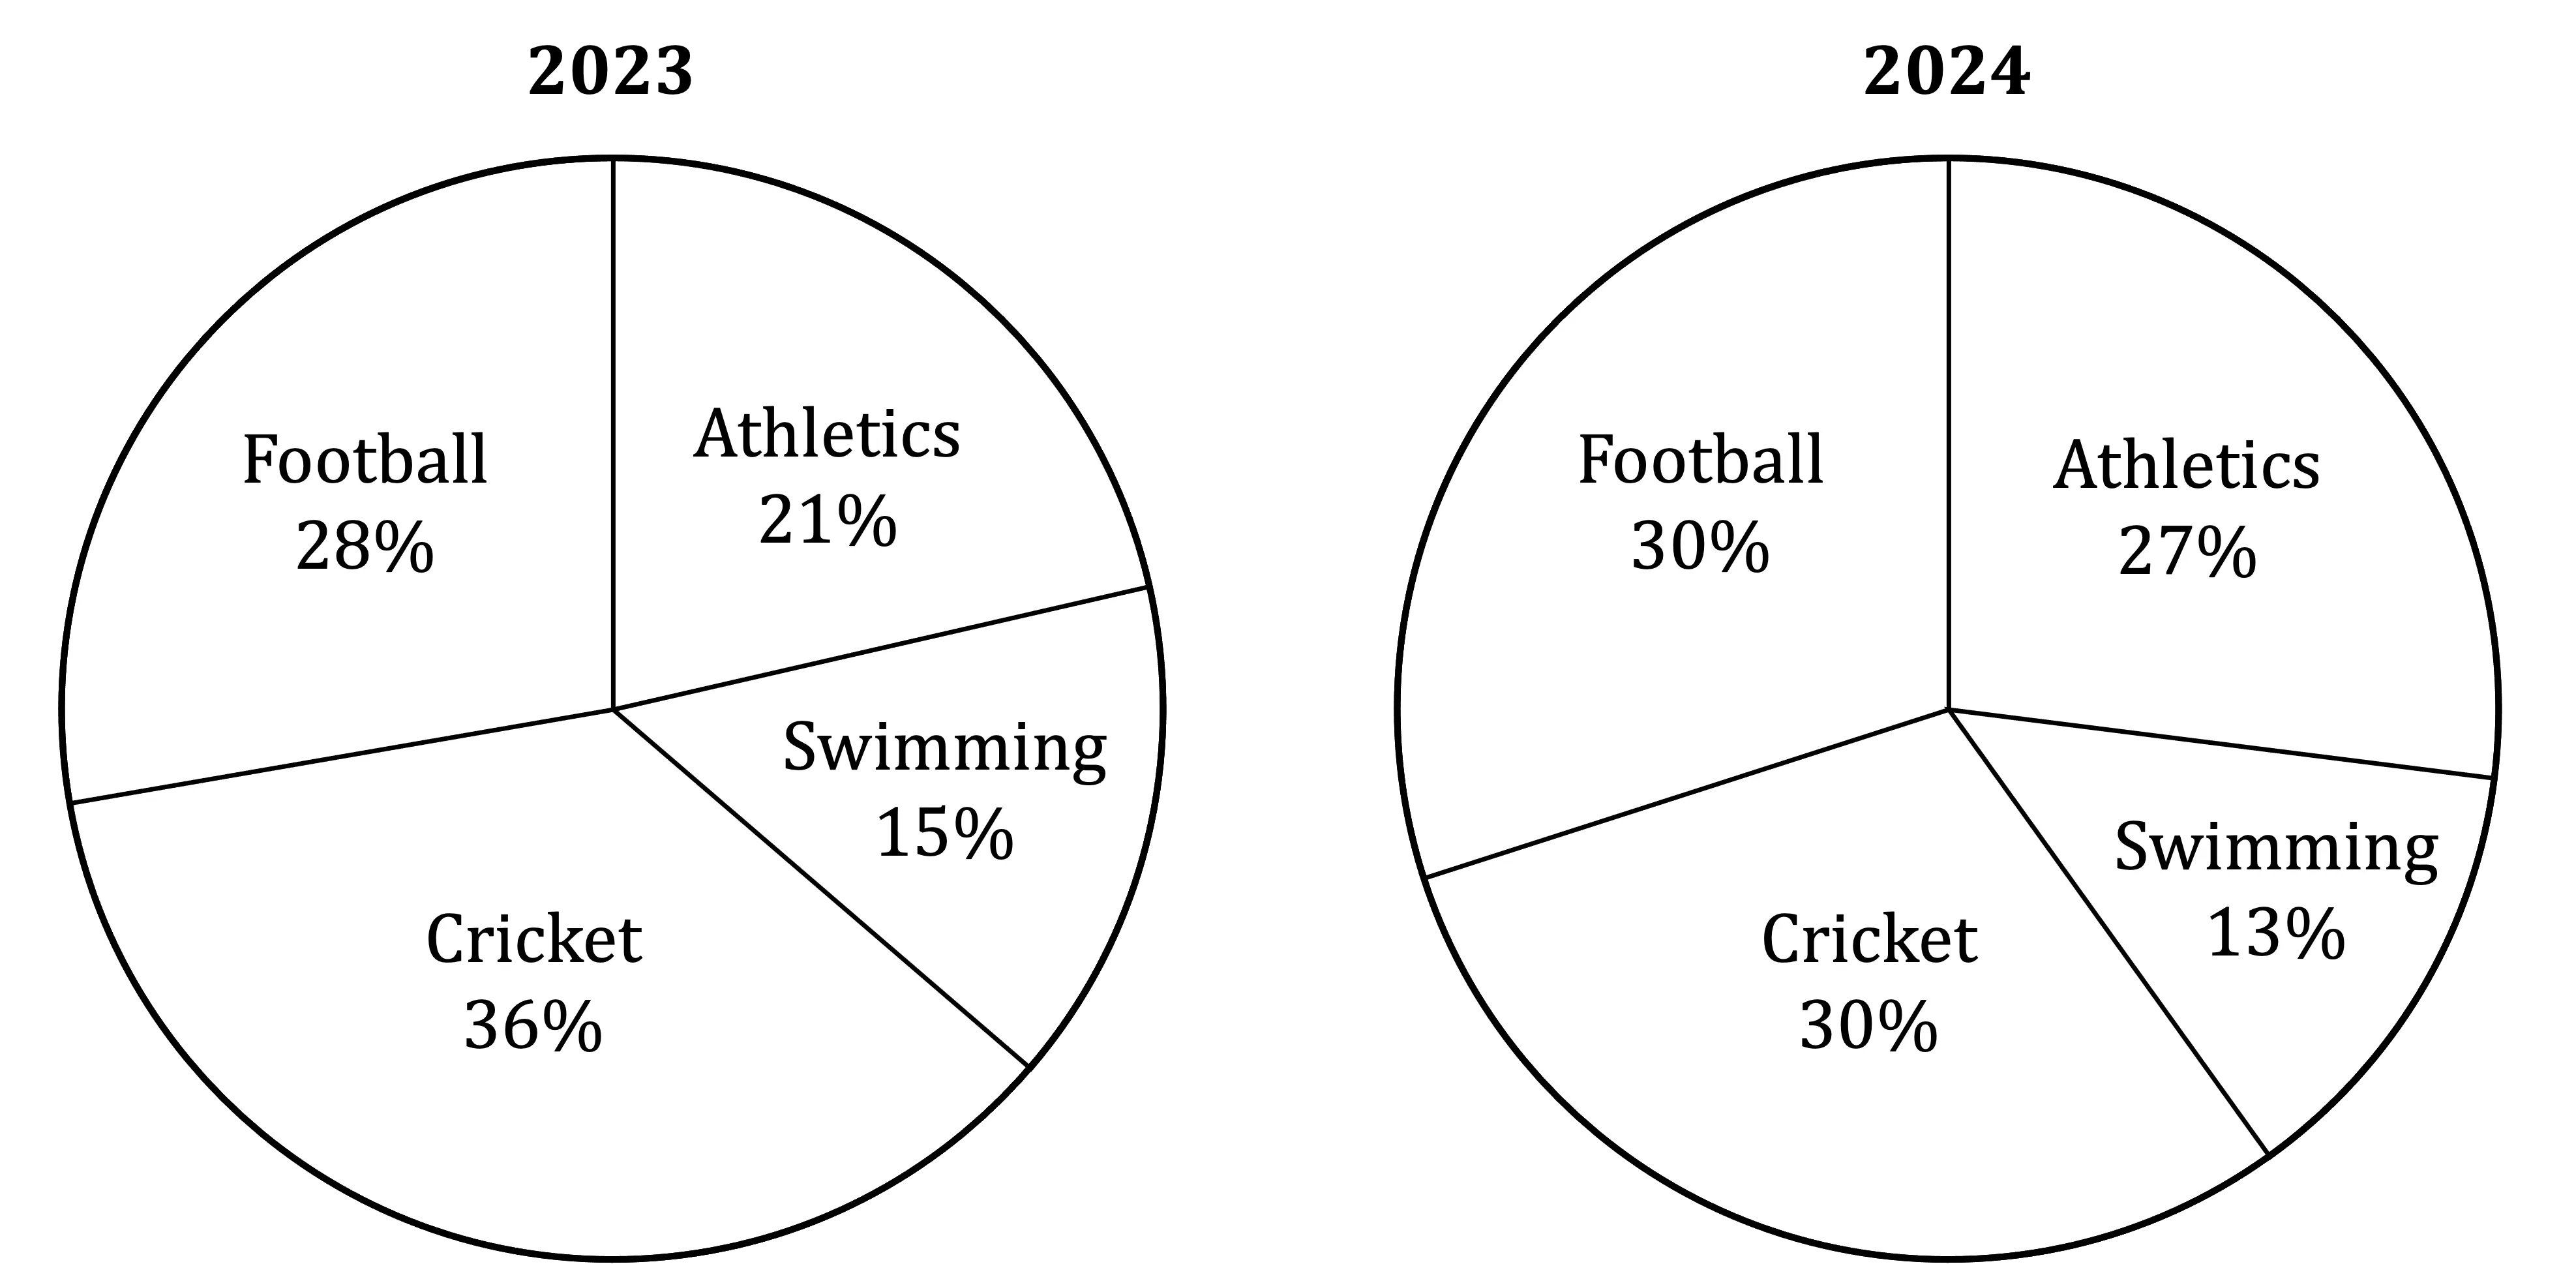
The pie charts do not show that there were more children who attended the summer activity camp in 2024 than in 2023.
Explain why.
1.2. The number of children who attended the summer activity camp in 2024 to train in football was 252.
Work out the number of children that attended the summer activity camp in 2024 who trained in athletics.
1.3. The table gives information about the total number of children to attend the summer activity camp in 2023 and 2024.
Month | Total number of children |
|---|---|
2023 | 900 |
2024 | 1600 |
Kofi thinks there is a more appropriate way to draw pie charts now that he knows the information in the table.
Explain, giving reasons, how he should do this, and why it is more appropriate.
You must refer to the information in the table in your explanation.

Ai এর মাধ্যমে

১০ লক্ষ+ প্রশ্ন ডাটাবেজ

প্র্যাকটিস এর মাধ্যমে নিজেকে তৈরি করে ফেলো
উত্তর দিবে তোমার বই থেকে ও তোমার মত করে।

সারা দেশের শিক্ষার্থীদের মধ্যে নিজের অবস্থান যাচাই
No related questions found

