Fieldwork
1. This question has 5 part(s).
1.1. The students wanted to test the following hypotheses.
Hypothesis 1: Most international migrants who live in Rome were born in Europe.
Hypothesis 2: Pull factors affected the decision to migrate to Rome more than push factors.
The students went to a district of Rome near the main railway station where many migrant families lived.
They used the questionnaire shown in Figure 2.1
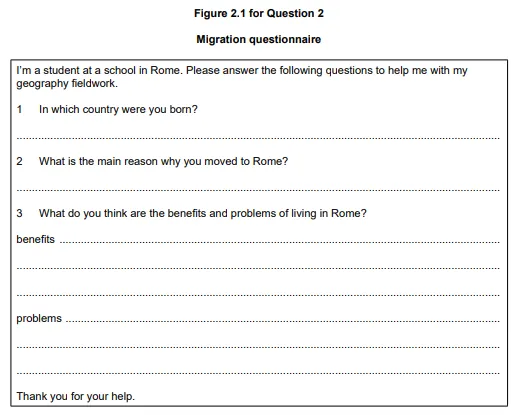
Describe how the students could use a random sampling method to select 100 people to complete their questionnaire.
1.2. Suggest why the students asked people ‘Have you moved to live in Rome from abroad?’ before beginning the questionnaire.
1.3. Suggest two other pieces of advice the teacher could give the students about how to use the questionnaire.
1.4. The students used the answers to Question 1 in the questionnaire (In which country were you born?) to investigate Hypothesis 1: Most international migrants who live in Rome were born in Europe.
Figure 2.2, a flow line map, shows the countries in Africa, Asia and South America where migrants were born.
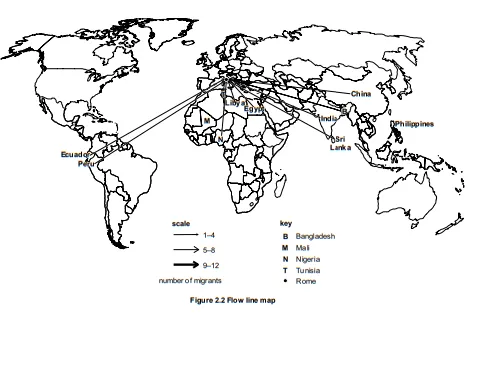
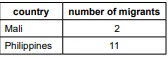
On Figure 2.2, use the following data to plot the number of migrants born in Mali and the Philippines.
1.5. Why is a flow line map an appropriate method to show the data from Question 1 of the questionnaire?

Ai এর মাধ্যমে

১০ লক্ষ+ প্রশ্ন ডাটাবেজ

প্র্যাকটিস এর মাধ্যমে নিজেকে তৈরি করে ফেলো
উত্তর দিবে তোমার বই থেকে ও তোমার মত করে।

সারা দেশের শিক্ষার্থীদের মধ্যে নিজের অবস্থান যাচাই
No related questions found

