Time Series
1. This question has 5 part(s).
1.1. The tables show information about the number of episodes and viewing figures for two television programs, Emmerdale and Eastenders, for the years 2015 to 2018
Emmerdale | Total number of episodes | Highest viewing figure (millions) | Lowest viewing figure (millions) |
|---|---|---|---|
Year | |||
2015 | 291 | 6.53 | 4.04 |
2016 | 308 | 8.03 | 4.95 |
2017 | 302 | 7.54 | 5.01 |
2018 | 119 | 7.72 | 5.72 |
Eastenders | Total number of episodes | Highest viewing figure (millions) | Lowest viewing figure (millions) |
|---|---|---|---|
Year | |||
2015 | 209 | 9.87 | 5.43 |
2016 | 210 | 9.47 | 4.83 |
2017 | 209 | 8.41 | 4.19 |
2018 | 206 | 7.81 | 4.56 |
(i) In which of these years did Eastenders have its greatest number of episodes?
(1)
(ii) What was the highest viewing figure for Emmerdale between 2015 and 2018?
................... million
(1)
1.2. Explain why the viewing figures in the table may not be accurate.
1.3. Compare the number of episodes for Emmerdale in 2016 with the number of episodes for Eastenders in 2016
Give a reason for your answer.
1.4. The incomplete graph shows the highest viewing figures for Emmerdale and for Eastenders between 2015 and 2018
Use the values for the highest viewing figures for Emmerdale from the table to complete the graph.
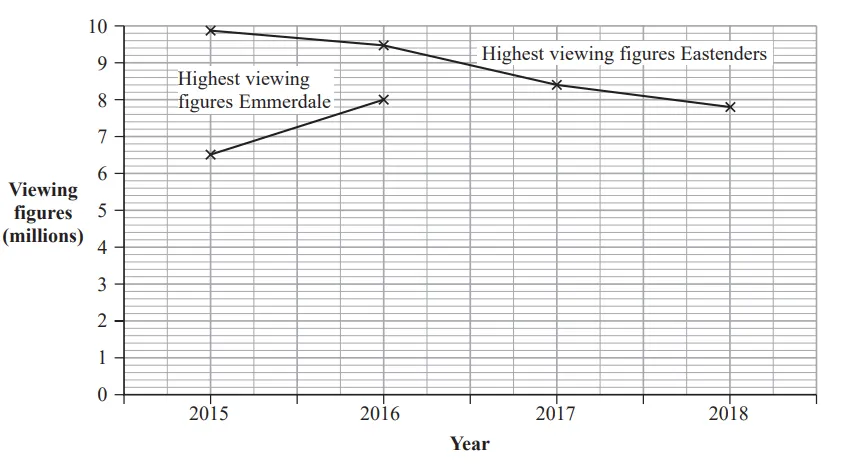
1.5. Describe the trend for the highest viewing figures for Eastenders between 2015 and 2018

Ai এর মাধ্যমে

১০ লক্ষ+ প্রশ্ন ডাটাবেজ

প্র্যাকটিস এর মাধ্যমে নিজেকে তৈরি করে ফেলো
উত্তর দিবে তোমার বই থেকে ও তোমার মত করে।

সারা দেশের শিক্ষার্থীদের মধ্যে নিজের অবস্থান যাচাই
No related questions found

