Data Presentation
1. This question has 2 part(s).
1.1. Police check the speed of vehicles travelling along a stretch of highway. The cumulative frequency curve below summarises the data for the speeds, in kmph, of 80 vehicles:
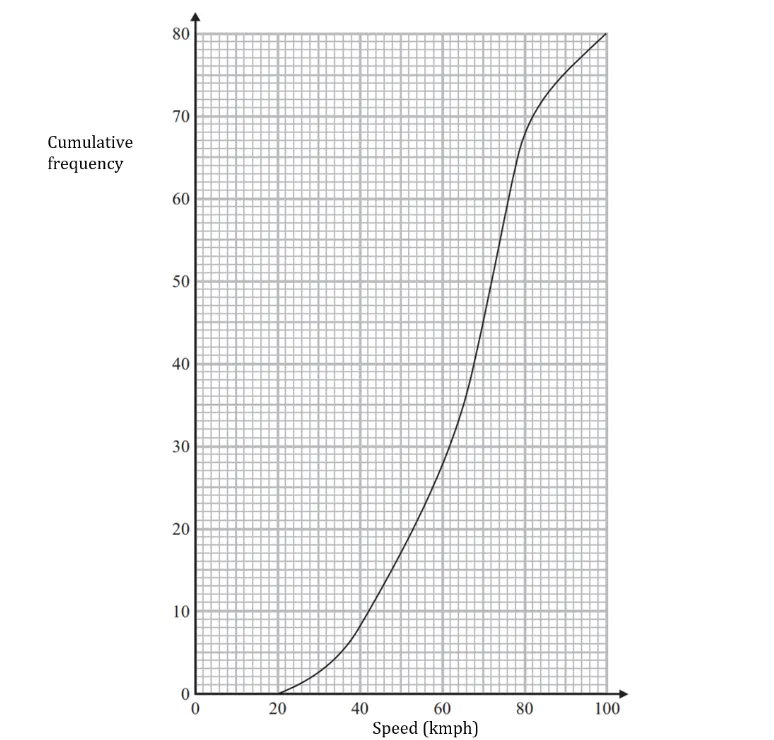
Use the graph to find an estimate for the median speed.
1.2. The speed limit for this section of road is 80 kmph.
Vehicles travelling above the speed limit are issued with a speeding ticket. Those travelling more than 10% over the speed limit are pulled over. Use the graph to estimate the percentage of vehicles that the police pull over.

Ai এর মাধ্যমে

১০ লক্ষ+ প্রশ্ন ডাটাবেজ

প্র্যাকটিস এর মাধ্যমে নিজেকে তৈরি করে ফেলো
উত্তর দিবে তোমার বই থেকে ও তোমার মত করে।

সারা দেশের শিক্ষার্থীদের মধ্যে নিজের অবস্থান যাচাই
No related questions found

