Cumulative Frequency & Box Plots
1. This question has 2 part(s).
1.1. The cumulative frequency graphs show information about the times taken by 100 male runners and by 100 female runners to finish the London marathon.
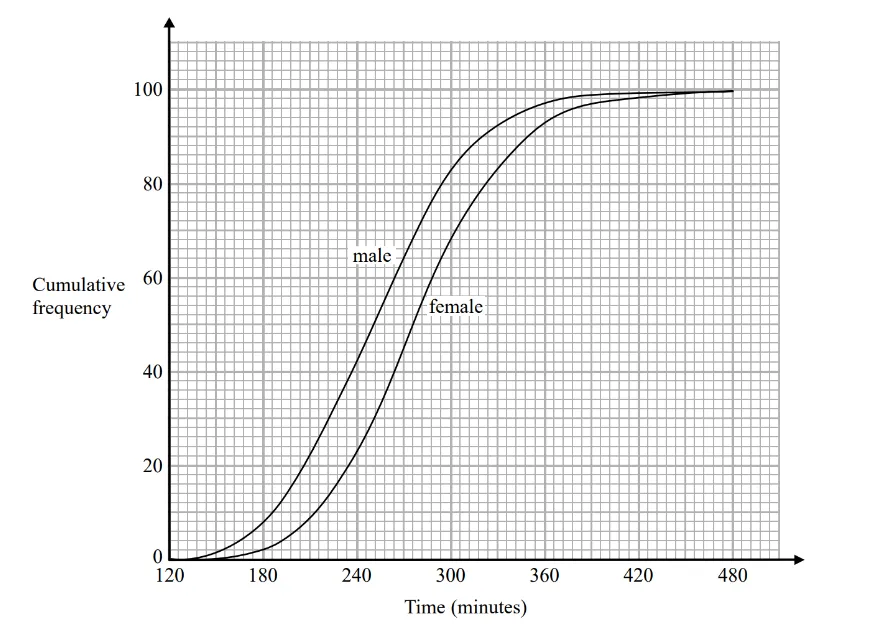
A male runner is chosen at random.
Find an estimate for the probability that this runner took less than 4 hours to finish the London marathon.
1.2. Use medians and interquartile ranges to compare the distribution of the times taken by the male runners with the distribution of the times taken by the female runners.

Ai এর মাধ্যমে

১০ লক্ষ+ প্রশ্ন ডাটাবেজ

প্র্যাকটিস এর মাধ্যমে নিজেকে তৈরি করে ফেলো
উত্তর দিবে তোমার বই থেকে ও তোমার মত করে।

সারা দেশের শিক্ষার্থীদের মধ্যে নিজের অবস্থান যাচাই
No related questions found

