Infrared Spectroscopy
1. This question has 4 part(s).
1.1. Unknown organic compound C is analysed by mass spectrometry and infra-red spectroscopy. The mass spectrum is shown in Fig. 2.1 and the infra-red spectrum is shown in Fig. 2.2.
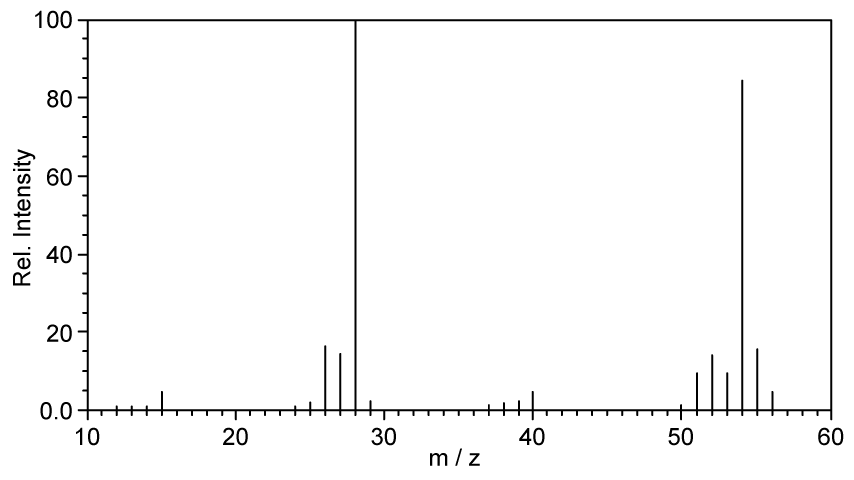
Fig 2.1
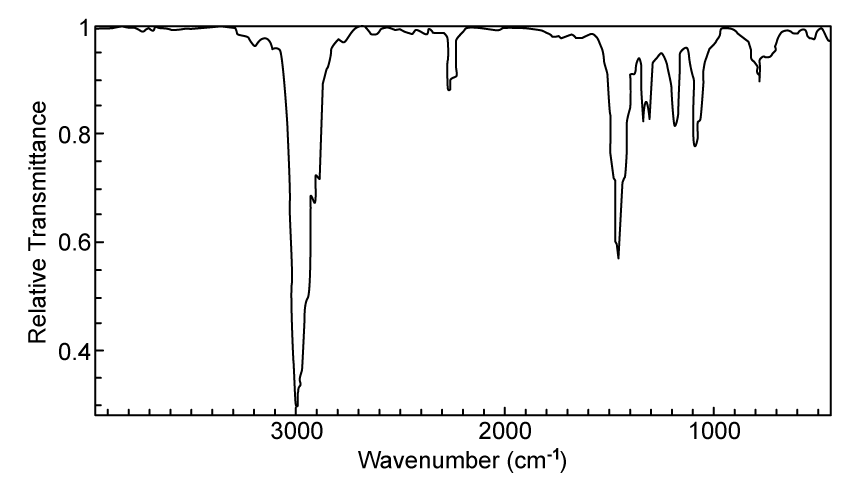
Fig 2.2
Deduce one possible identity for compound C. Explain your answer.
In your answer, use the molecular ion peak at m / e = 55, relevant infra-red absorptions in the region above 1500 cm-1 and Table 2.1.
Table 2.1
Bond | Functional groups containing | Characteristic infrared absorption range (in wavenumber) / cm–1 |
C−O | hydroxy, ester | 1040 – 1300 |
C=C | aromatic compound, alkene | 1500 – 1680 |
C=O | amide | 1640 – 1690 |
C≡N | nitrile | 2200 – 2250 |
C−H | alkane | 2850 – 2950 |
N−H | amine, amide | 3300 – 3500 |
O−H | carboxyl | 2500 – 3000 |
1.2. The mass spectrum of compound C shows an M+1 peak at m / e = 56.
Suggest two ways that this peak could be formed.
1.3. Calculate the expected elemental percentage composition by mass of an 8.0 g sample of compound C. Give your answers to significant figures.
1.4. Compound C undergoes a reaction to form compound D. The IR spectrum of compound D is shown in Fig. 2.3.
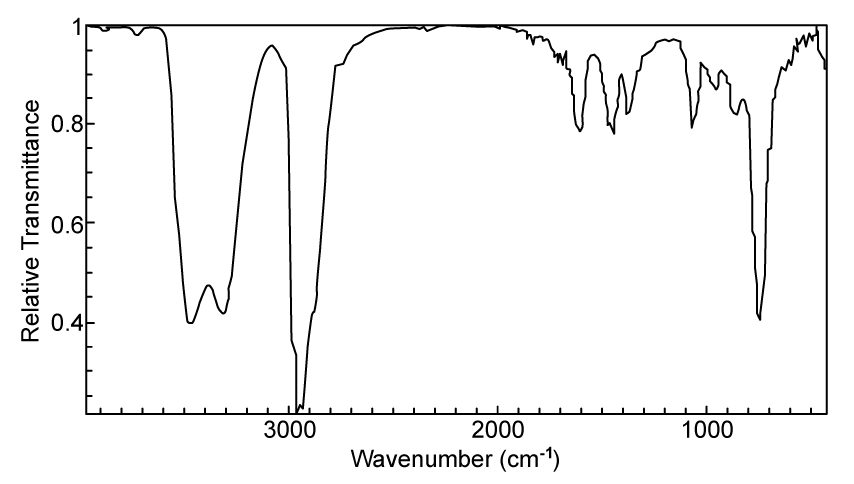
Fig. 2.3
State the reagents required for this reaction. In your answer, use Table 2.1 and identify any relevant absorptions in the infra-red spectrum to justify your answer.

Ai এর মাধ্যমে

১০ লক্ষ+ প্রশ্ন ডাটাবেজ

প্র্যাকটিস এর মাধ্যমে নিজেকে তৈরি করে ফেলো
উত্তর দিবে তোমার বই থেকে ও তোমার মত করে।

সারা দেশের শিক্ষার্থীদের মধ্যে নিজের অবস্থান যাচাই
No related questions found

