Trophic Levels in an Ecosystem
1. This question has 5 part(s).
1.1. Figure 2 shows a food chain for organisms in an area of grassland. Also included is the biomass of the organisms at each trophic level.
Figure 2
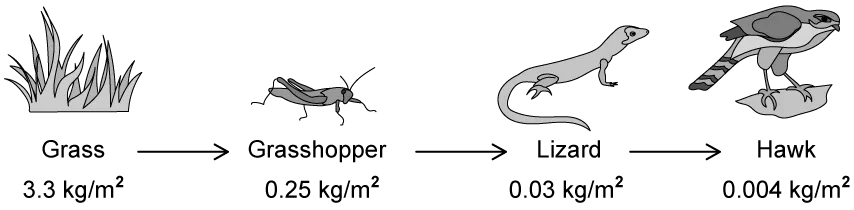
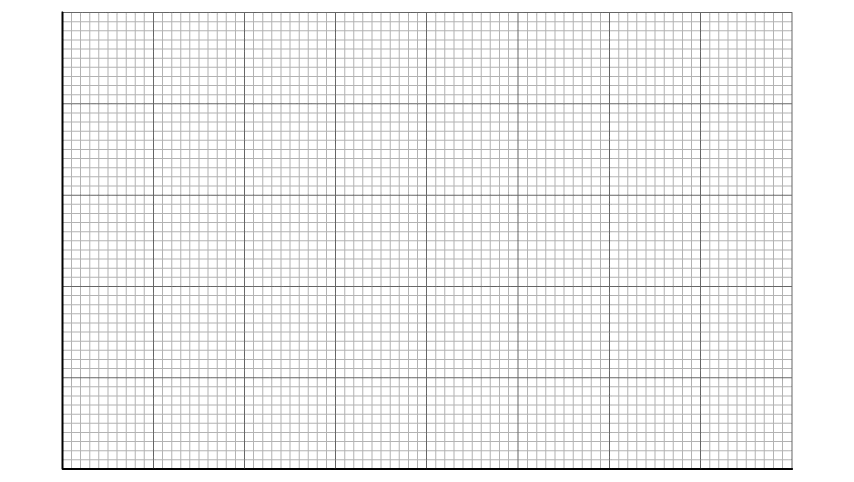
Draw a pyramid of biomass for the food chain in Figure 2 on Figure 3.
You should:
use a suitable scale
label the x-axis
label each trophic level
Figure 3
1.2. Biomass is a measure of the mass of a number of organisms, so a scientist might be tempted to measure biomass in the units of mass, kilograms (kg). However, the unit used in the food chain shown in Figure 2 is kg/m2.
Explain why.
1.3. Some units of biomass are expressed with a consideration of time.
For example, one such unit is kg m-2 yr-1, which stands for kilograms per square metre per year.
Suggest a reason why a time consideration is given to the measurement of biomass.
1.4. Calculate the percentage efficiency of the food chain shown in Figure 2.
Give your answer to 2 significant figures.
1.5. Explain why a pyramid of biomass often only has a narrow line to depict the apex predator, rather than rectangular box.

Ai এর মাধ্যমে

১০ লক্ষ+ প্রশ্ন ডাটাবেজ

প্র্যাকটিস এর মাধ্যমে নিজেকে তৈরি করে ফেলো
উত্তর দিবে তোমার বই থেকে ও তোমার মত করে।

সারা দেশের শিক্ষার্থীদের মধ্যে নিজের অবস্থান যাচাই
No related questions found

