Quantitative & Qualitative skills
1. The student tested for a correlation between the two sets of data in Figure 6, using a Spearman’s rank correlation test.
Figure 7 shows how he set out the data and started his calculations.
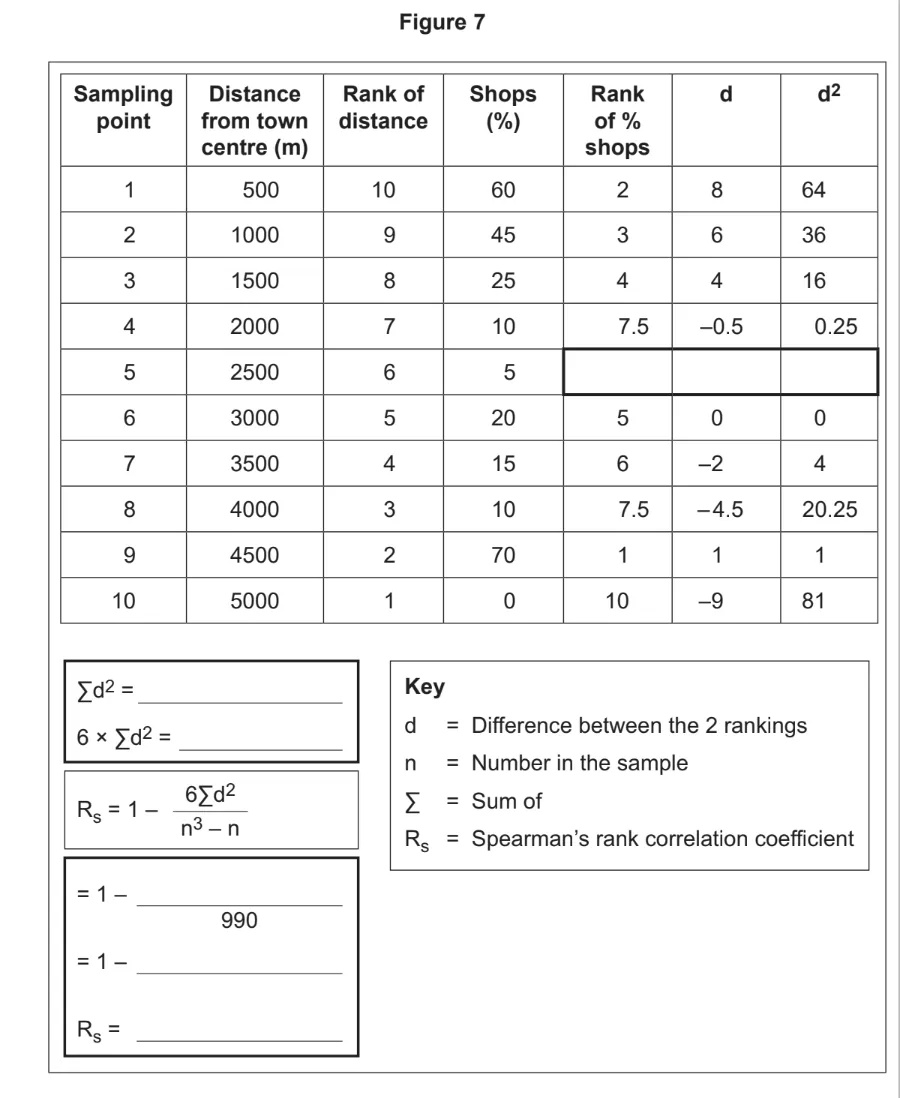
Figure 8 shows critical values of Rs for Spearman’s rank correlation coefficient.
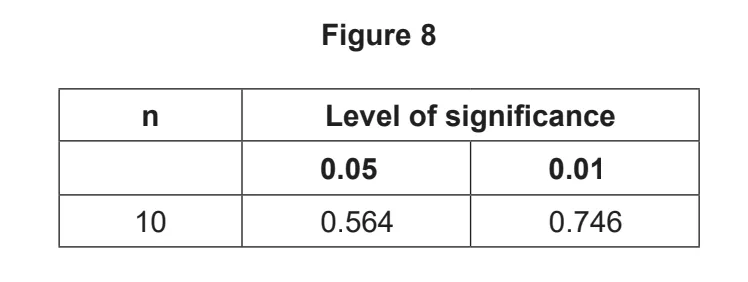
Complete the calculation of Rs in Figure 7 to two decimal places and use Figure 8 to interpret these findings.

Ai এর মাধ্যমে

১০ লক্ষ+ প্রশ্ন ডাটাবেজ

প্র্যাকটিস এর মাধ্যমে নিজেকে তৈরি করে ফেলো
উত্তর দিবে তোমার বই থেকে ও তোমার মত করে।

সারা দেশের শিক্ষার্থীদের মধ্যে নিজের অবস্থান যাচাই
No related questions found

