Graphs in Kinematics
1. This question has 2 part(s).
1.1. The diagram below shows the velocity-time graph for a train travelling between two stations, starting at station P and finishing at station Q. The graph indicates velocity in kilometres per hour and time in minutes.
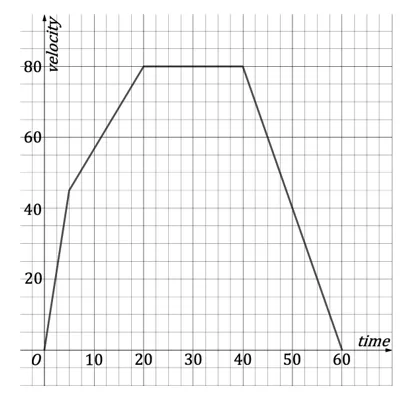
Find the distance between station P and station Q.
1.2. Find the deceleration of the train in the last 20 minutes.

Ai এর মাধ্যমে

১০ লক্ষ+ প্রশ্ন ডাটাবেজ

প্র্যাকটিস এর মাধ্যমে নিজেকে তৈরি করে ফেলো
উত্তর দিবে তোমার বই থেকে ও তোমার মত করে।

সারা দেশের শিক্ষার্থীদের মধ্যে নিজের অবস্থান যাচাই
No related questions found

