Working with Data
1. Casey is another member of Sam’s research group. She believes that the masses of male and female gentoo penguins follow different distributions. The cumulative frequency graphs below show the masses of the male and female gentoo penguins in the sample.
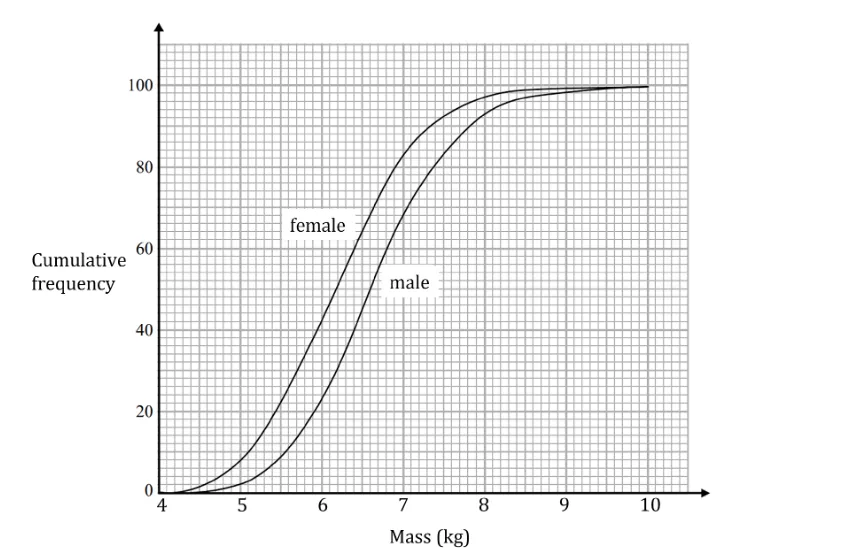
By calculating a measure of central tendency and a measure of variation, compare the two distributions.

Ai এর মাধ্যমে

১০ লক্ষ+ প্রশ্ন ডাটাবেজ

প্র্যাকটিস এর মাধ্যমে নিজেকে তৈরি করে ফেলো
উত্তর দিবে তোমার বই থেকে ও তোমার মত করে।

সারা দেশের শিক্ষার্থীদের মধ্যে নিজের অবস্থান যাচাই
No related questions found

