চর্চাচর্চা
রেজিস্ট্রেশন
Chorcha
01605-002711
[email protected]
Moho, House No- 568, Road 1/A, Rajshahi 6207

Features

Mock Exam
Question Bank

Streams

SSC Science
HSC Science
HSC Arts
HSC Commerce
BCS/Job

Company

About
OurSchool
Affiliates
Help
FAQ

Legal

Terms & Conditions
Privacy Policy
Refund Policy
E-TIN NUMBER: 371617991290
Trade licence No: 03/B - 2673
Get it on Google PlayDownload on the app store

© 2026 Chorcha Tech Ltd. All rights reserved.

Institution management for schools — ourschool.io

Scatter Graphs & Correlation

1. This question has 4 part(s).

Nov 2020 0580/11 18
1WRITTEN (2 pts)

1.1. Aisha records the distance she runs and her average speed. The results are shown in the scatter diagram.
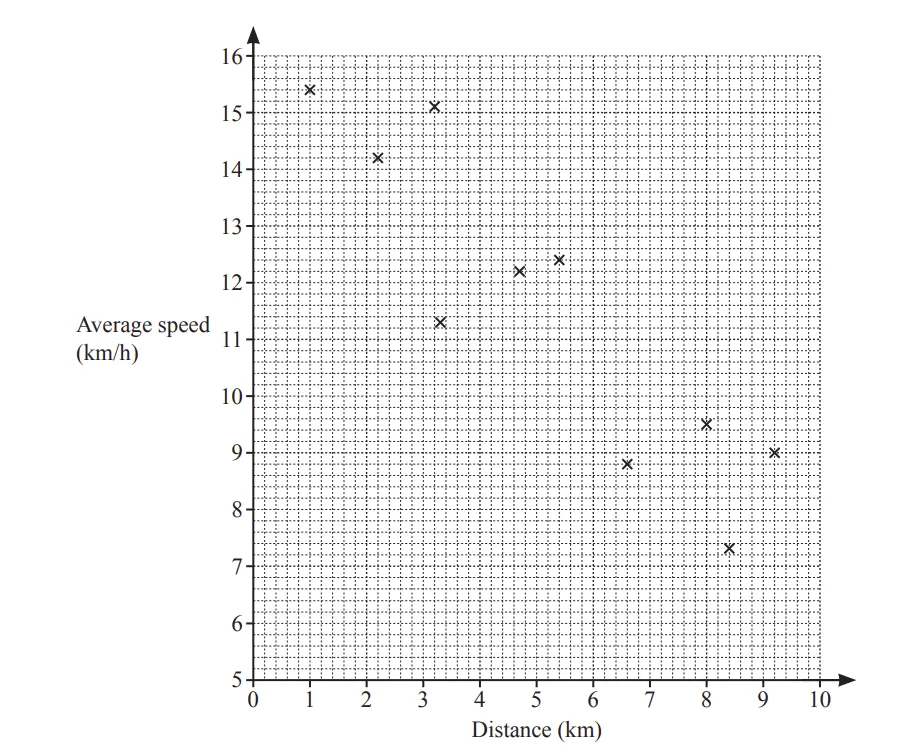
The table shows the results of four more runs.

Distance (km)

4.2

5.7

7.1

8.8

Average speed (km/h)

13.4

11.8

9.8

8.3

On the scatter diagram, plot these points.

সংক্ষিপ্ত উত্তর প্রশ্ন
2WRITTEN (1 pts)

1.2. What type of correlation is shown in the scatter diagram?

সংক্ষিপ্ত উত্তর প্রশ্ন
3WRITTEN (3 pts)

1.3. The mean distance of Aisha's first ten runs (already plotted on the scatter diagram) is 5.2 km.

The mean speed of all 14 of Aisha's runs is 11.3 km/h correct to 1 decimal place.

On the scatter diagram, draw a line of best fit.

সংক্ষিপ্ত উত্তর প্রশ্ন
4WRITTEN (1 pts)

1.4. Use your line of best fit to estimate her average speed when she runs a distance of 6km.

..........................km/h 

সংক্ষিপ্ত উত্তর প্রশ্ন
Scatter Graphs & Correlation টপিকের ওপরে পরীক্ষা দাও
ai robot

তোমার যে কোন ডাউট সলভ করো চর্চা

Ai এর মাধ্যমে

Try চর্চা Ai
বিগত বছরসমূহের প্রশ্ন ব্যাংক

বিগত বছরসমূহের প্রশ্ন ব্যাংক

১০ লক্ষ+ প্রশ্ন ডাটাবেজ

আনলিমিটেড পরীক্ষা ও ব্যাখ্যা

আনলিমিটেড পরীক্ষা ও ব্যাখ্যা

প্র্যাকটিস এর মাধ্যমে নিজেকে তৈরি করে ফেলো

ডাউট সলভিং চর্চা AI

ডাউট সলভিং চর্চা AI

উত্তর দিবে তোমার বই থেকে ও তোমার মত করে।

সারা দেশব্যাপী লিডারবোর্ড

সারা দেশব্যাপী লিডারবোর্ড

সারা দেশের শিক্ষার্থীদের মধ্যে নিজের অবস্থান যাচাই

সবকিছু এক প্রিমিয়াম প্যাকেজে

Related question

No related questions found

