Astronomy
1. This question has 2 part(s).
1.1. A Hertzsprung-Russell (HR) diagram shows how the luminosity L depends on the surface temperature T for a group of stars.
The HR diagram below is for a young star cluster.
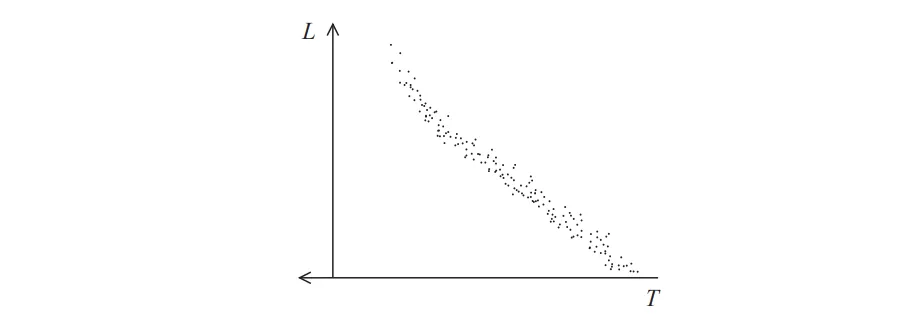
i) Explain how we can tell that the young star cluster is in the early stages of its evolution.
(2)
ii) Explain why the most massive stars in the cluster have the greatest luminosities.
(4)
1.2. The HR diagram on the previous page shows an approximately linear relationship for stars in this cluster.
i) It is suggested that the relationship between luminosity L and surface temperature T is of the form
where k and n are constants.
Explain why a graph of log L against log T would give a straight line.
(2)
ii) The table shows data for stars in this cluster.
L / LSun | T / K | ||
39.5 | 10 600 | ||
545 | 16 400 | ||
20 600 | 26 800 | ||
535 000 | 44 900 | ||
1 770 000 | 53 300 |
Plot a graph of log L against log T on the grid below. Use the columns provided to show any processed data.
(5)
iii) Determine a value for n.
n = .......................................................(2)


Ai এর মাধ্যমে

১০ লক্ষ+ প্রশ্ন ডাটাবেজ

প্র্যাকটিস এর মাধ্যমে নিজেকে তৈরি করে ফেলো
উত্তর দিবে তোমার বই থেকে ও তোমার মত করে।

সারা দেশের শিক্ষার্থীদের মধ্যে নিজের অবস্থান যাচাই
No related questions found

