Further Correlation & Regression
1. This question has 3 part(s).
1.1. M.Hatter has noticed that over the past 50 years there seems to be fewer hatmakers in London. He also knows that global temperatures have been rising over the same time period. He decides to see if there could be any correlation, so he collects data on the number of hatmakers and the global mean temperatures from the past 50 years and records the information in the graph below.
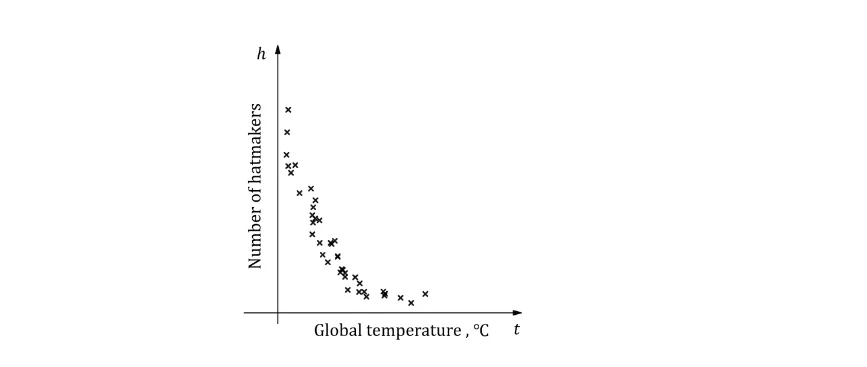
Explain why a model of h = at + b is unlikely to fit these data.
1.2. Hatter suggests that the equation for h in terms of t can be written in the form h = abt. He codes the data using x = t and y = log h and calculates the regression line of y on x to be y = 1.903 –1.005x.
(i) Show that a = 80.0 correct to 3 significant figures.
(ii) Find the value of b to 3 significant figures.
(iii) Give an interpretation, in context, of the value of a in your answer to (b)(i).
1.3. M.Hatter calculates the product moment correlation coefficient between x and y to be r = 0.952 and concludes that the rise in mean global temperature is what is causing hatmakers in London to go out of business.
Explain whether M. Hatter’s conclusion is fully justified.

Ai এর মাধ্যমে

১০ লক্ষ+ প্রশ্ন ডাটাবেজ

প্র্যাকটিস এর মাধ্যমে নিজেকে তৈরি করে ফেলো
উত্তর দিবে তোমার বই থেকে ও তোমার মত করে।

সারা দেশের শিক্ষার্থীদের মধ্যে নিজের অবস্থান যাচাই
No related questions found

