Further Correlation & Regression
1. This question has 3 part(s).
1.1. It is believed that the relationship between two variables, x and y, can be modelled by y = bpx. By first taking logarithms of both sides and then by using the laws of logarithms, show that y = bpx can be written as log y = log b + x log p .
1.2. The scatter diagram below shows the relationship between two sets of data, x and log y. The regression line of log y on x is shown and passes through the points (3, 0.7) and (7, 1.3).
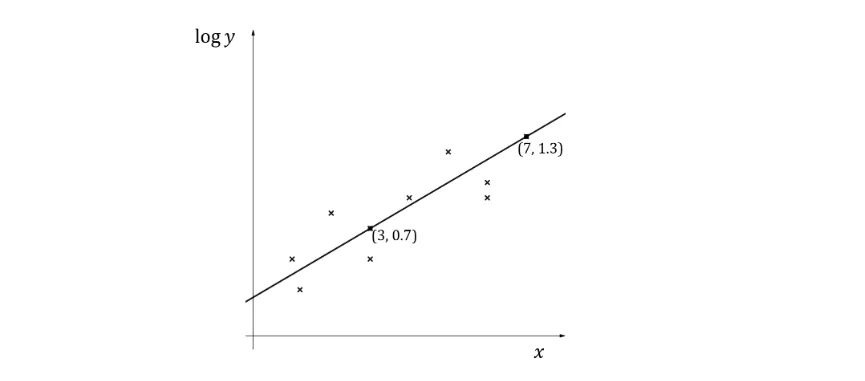
(i) Using the given coordinates, find the gradient of the regression line shown.
(ii) Find the regression line of log y on x in the form log y = a + mx, where a and m are constants to be found.
1.3. (i) By comparing the equations in (a) and (b)(ii) show that b = 1.778 to three decimal places.
(ii) Find the value of p to three decimal places.

Ai এর মাধ্যমে

১০ লক্ষ+ প্রশ্ন ডাটাবেজ

প্র্যাকটিস এর মাধ্যমে নিজেকে তৈরি করে ফেলো
উত্তর দিবে তোমার বই থেকে ও তোমার মত করে।

সারা দেশের শিক্ষার্থীদের মধ্যে নিজের অবস্থান যাচাই
No related questions found

