Histograms
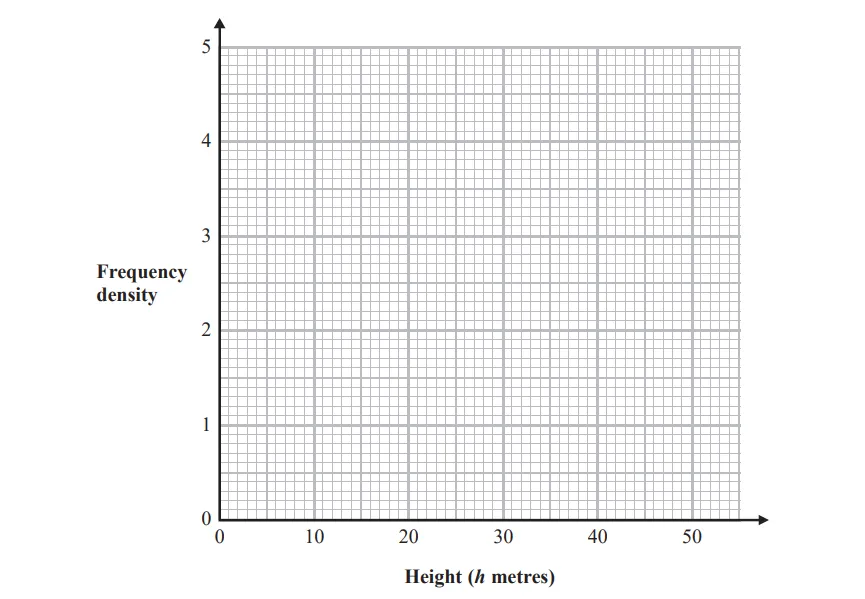
1. The table gives information about the heights of some trees.
Height ( metres) | Frequency |
0</p></td><td><p style="line-height: 1.7" class="text-lg tracking-wide font-normal leading-relaxed">\(15 | |
20</p></td><td><p style="line-height: 1.7" class="text-lg tracking-wide font-normal leading-relaxed">\(48 | |
35</p></td><td><p style="line-height: 1.7" class="text-lg tracking-wide font-normal leading-relaxed">\(21 | |
40</p></td><td><p style="line-height: 1.7" class="text-lg tracking-wide font-normal leading-relaxed">\(16 |
On the grid, draw a histogram for this information.

Ai এর মাধ্যমে

১০ লক্ষ+ প্রশ্ন ডাটাবেজ

প্র্যাকটিস এর মাধ্যমে নিজেকে তৈরি করে ফেলো
উত্তর দিবে তোমার বই থেকে ও তোমার মত করে।

সারা দেশের শিক্ষার্থীদের মধ্যে নিজের অবস্থান যাচাই
No related questions found

