Cumulative Frequency
1. The height, h cm, of each of 120 plants is measured.
The cumulative frequency diagram shows this information.
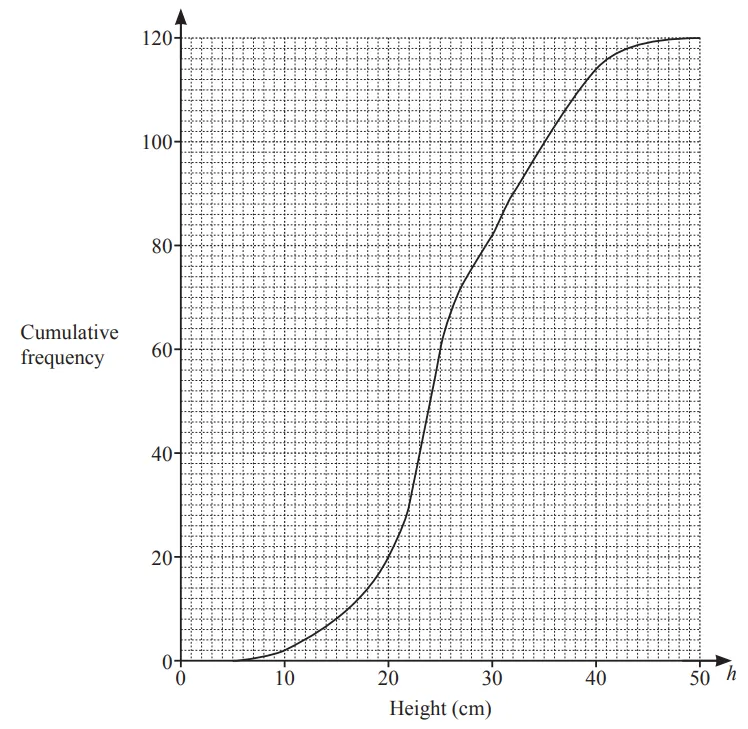
Use the cumulative frequency diagram to find an estimate of
i) the median,
............................................ cm [1]
ii) the interquartile range,
............................................ cm [2]
iii) the 60th percentile,
............................................ cm [1]
iv) the number of plants with a height greater than 40cm.
[2]

Ai এর মাধ্যমে

১০ লক্ষ+ প্রশ্ন ডাটাবেজ

প্র্যাকটিস এর মাধ্যমে নিজেকে তৈরি করে ফেলো
উত্তর দিবে তোমার বই থেকে ও তোমার মত করে।

সারা দেশের শিক্ষার্থীদের মধ্যে নিজের অবস্থান যাচাই
No related questions found

