Statistical Diagrams
1. The graph shows information about the number of maps sold between Tuesday and Sunday at a popular hiking destination.
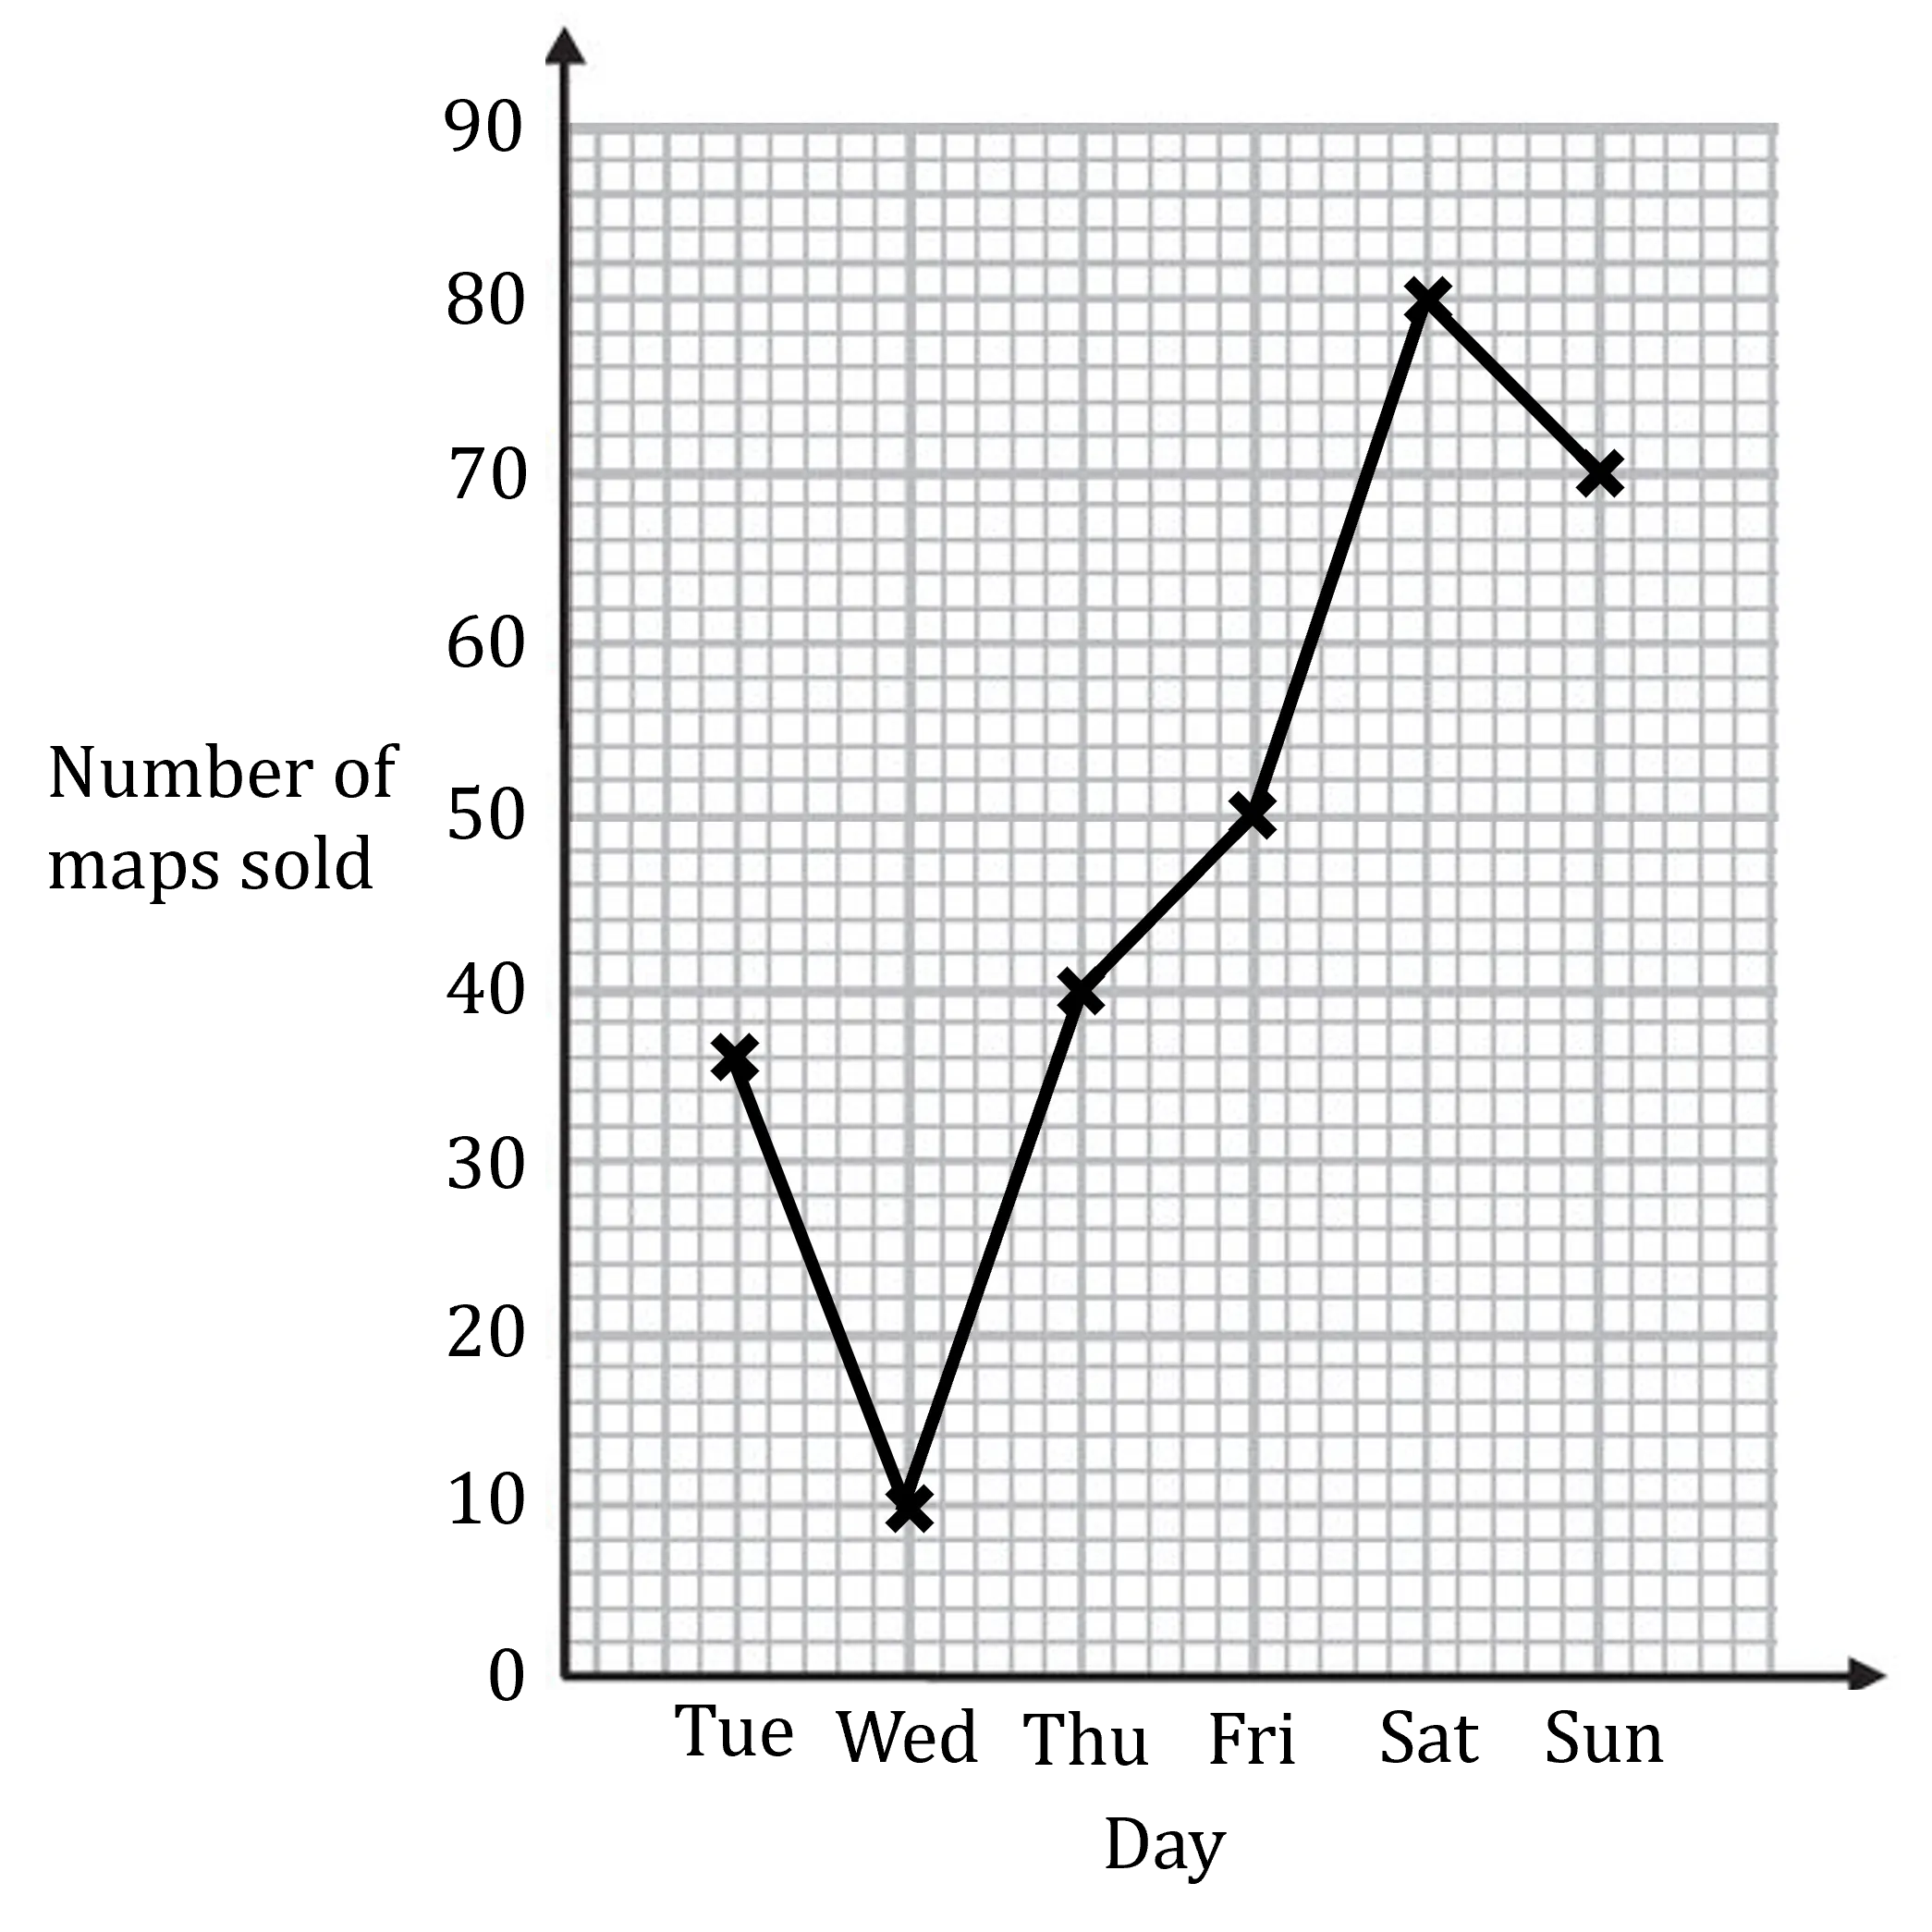
(i) Find the range of the number of maps sold between Tuesday and Sunday.
[1]
(ii) Find the median number of maps sold between Tuesday and Sunday.
[1]
(iii) A member of staff who sells the maps suggests that one of the data points is an outlier.
Identify which point they think is an outlier, and suggest a possible reason which may have caused this outlier.
[2]

Ai এর মাধ্যমে

১০ লক্ষ+ প্রশ্ন ডাটাবেজ

প্র্যাকটিস এর মাধ্যমে নিজেকে তৈরি করে ফেলো
উত্তর দিবে তোমার বই থেকে ও তোমার মত করে।

সারা দেশের শিক্ষার্থীদের মধ্যে নিজের অবস্থান যাচাই
No related questions found

