Energy Security
1. Figure 9a shows the world’s top ten coal producing countries in 2015. Figure 9b shows coal consumption in the top ten coal consuming countries and the rest of the world in 2015. Figure 9c shows a Spearman’s rank calculation used to study whether there is a relationship between production and consumption of coal in the countries shown in Figure 9a.
Figure 9a
The world’s top ten coal producing countries in 2015
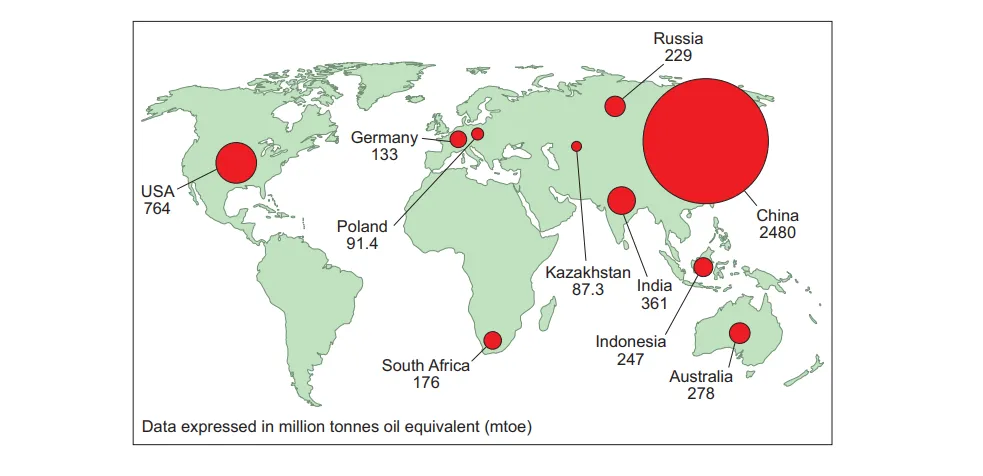
Figure 9b
Coal consumption in the top ten coal consuming countries and the
rest of the world in 2015
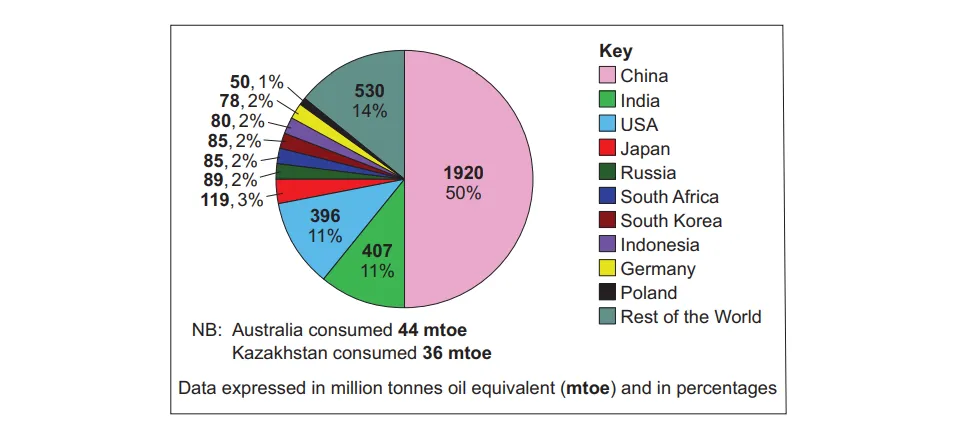
Figure 9c
The null hypothesis is: ‘There is no relationship between production of coal and consumption of coal.’
Rs Value | 0.806 |
Critical Value at 0.05 significance level (n = 10) | 0.648 |
Analyse the data shown in Figures 9a, 9b and 9c.
[6]

Ai এর মাধ্যমে

১০ লক্ষ+ প্রশ্ন ডাটাবেজ

প্র্যাকটিস এর মাধ্যমে নিজেকে তৈরি করে ফেলো
উত্তর দিবে তোমার বই থেকে ও তোমার মত করে।

সারা দেশের শিক্ষার্থীদের মধ্যে নিজের অবস্থান যাচাই
No related questions found

