Practical Skills & Data Analysis (Paper 3A)
1. This question has 5 part(s).
1.1. This question is about an experiment with a retractable steel tape measure.
The tape measure is placed at the edge of the bench and about of the steel tape is extended so that it overhangs the bench.
The tape is then locked in this position to stop it from retracting.
A student measures the dimensions and , the horizontal and vertical displacements of the free end of the tape, as shown in Figure 1.
Figure 1
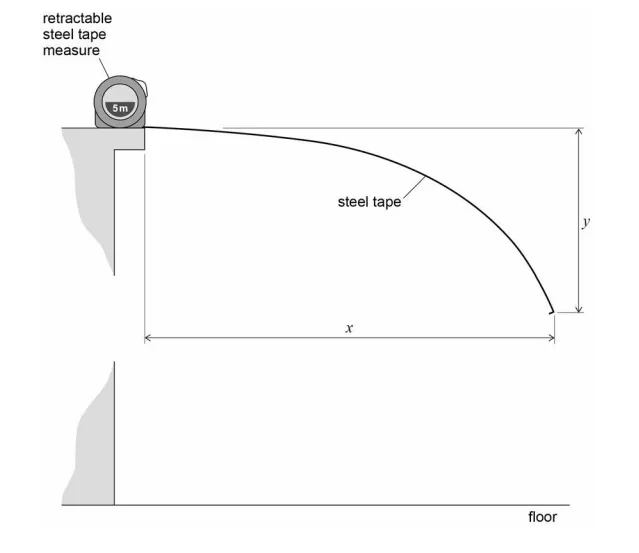
Describe a suitable procedure the student could use to measure .
You may add detail to Figure 1 to illustrate your answer.
1.2. By changing the extension of the tape, the student obtains further values of and .
These data are shown in Table 1.
Table 1
134.2 | 61.2 |
116.8 | 33.7 |
105.1 | 24.3 |
94.5 | 15.6 |
84.3 | 11.0 |
73.2 | 5.7 |
Suggest why the student chose to make all measurements of greater than .
1.3. The data from the experiment suggest that where is an integer and is a constant.
These data are used to plot the graph in Figure 2.
Determine using Figure 2.
Figure 2
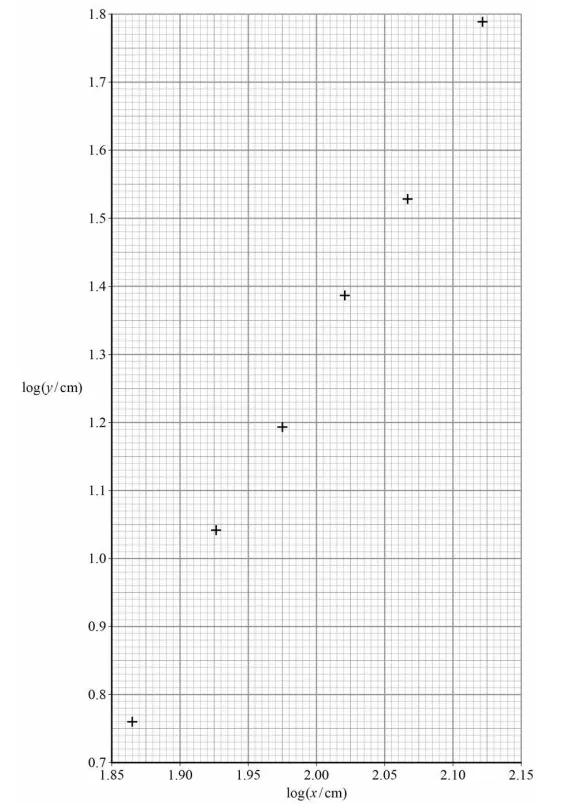
1.4. Explain how the numerical value of can be obtained from Figure 2.
1.5. Estimate the order of magnitude of .
You should use data for and from any one row in Table 1.
Give your answer with an appropriate unit.

Ai এর মাধ্যমে

১০ লক্ষ+ প্রশ্ন ডাটাবেজ

প্র্যাকটিস এর মাধ্যমে নিজেকে তৈরি করে ফেলো
উত্তর দিবে তোমার বই থেকে ও তোমার মত করে।

সারা দেশের শিক্ষার্থীদের মধ্যে নিজের অবস্থান যাচাই
No related questions found

