Feeding Relationships
1. This question has 3 part(s).
1.1. Two food chains are shown below:
Food chain 1: Soya bean plants → Salmon → Human
Food chain 2: Soya bean plants → Human
Figure 1 shows some data about the energy transferred between organisms in the food chains.
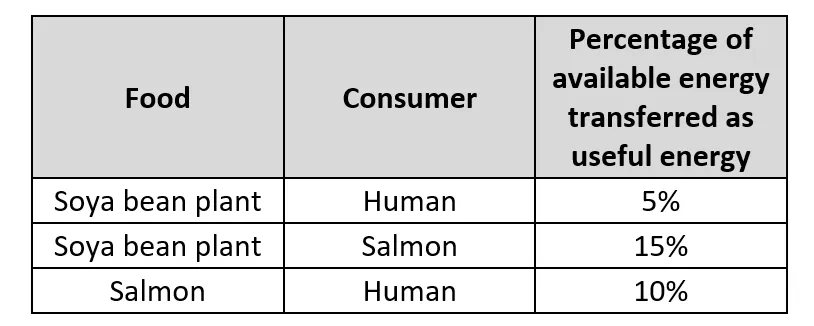
Figure 1
Using the information provided, compare the efficiency of these two food chains.
1.2. Figure 2 below shows a pyramid of numbers and a pyramid of biomass for an area of woodland.
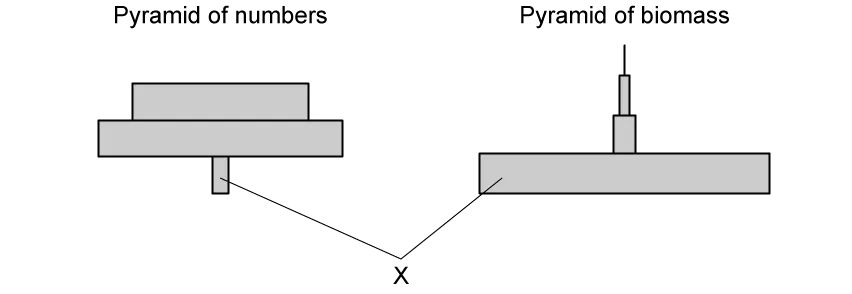
Figure 2
(i) Explain why the level labelled X is a different width in the two pyramids. (2)
(ii) Explain why a pyramid of biomass always forms a pyramid shape like the one shown in Figure 2.
(2)
1.3. Figure 3 shows a food chain in a woodland area.

Figure 3
Energy from the sun is captured by the plants in the wood.
Describe and explain the route of this energy through the food chain after it has been captured by the plants in the wood.

Ai এর মাধ্যমে

১০ লক্ষ+ প্রশ্ন ডাটাবেজ

প্র্যাকটিস এর মাধ্যমে নিজেকে তৈরি করে ফেলো
উত্তর দিবে তোমার বই থেকে ও তোমার মত করে।

সারা দেশের শিক্ষার্থীদের মধ্যে নিজের অবস্থান যাচাই
No related questions found

