Urban Enquiry Skills
1. Study Figure 10b which shows some results of a survey into land use and environmental quality (EQ score) along an urban transect.
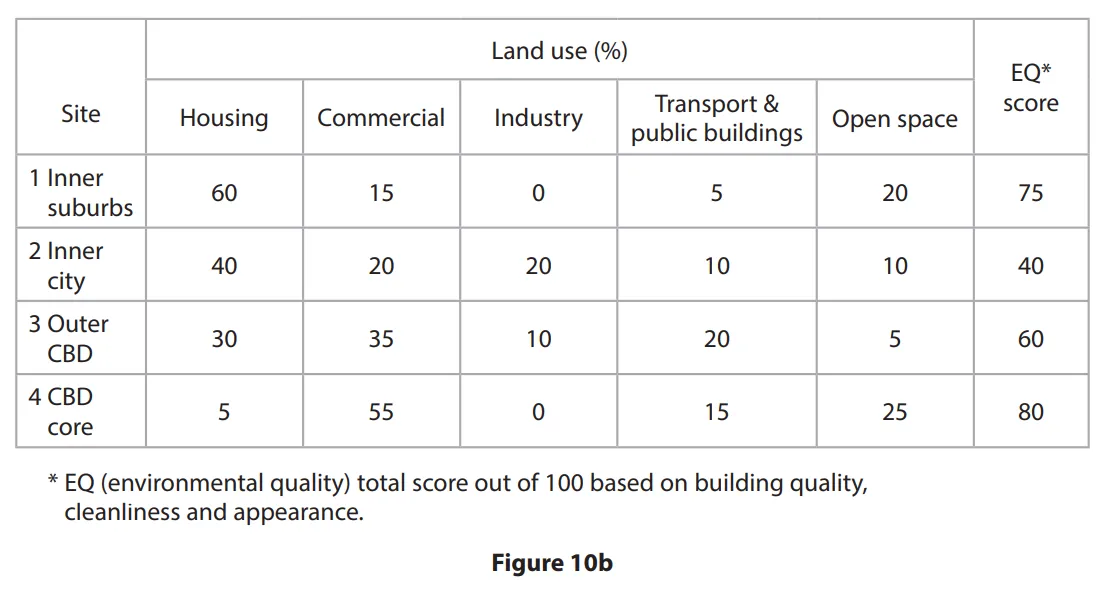
(i) Complete Figure 10c by representing the data for housing, open space and EQ score.
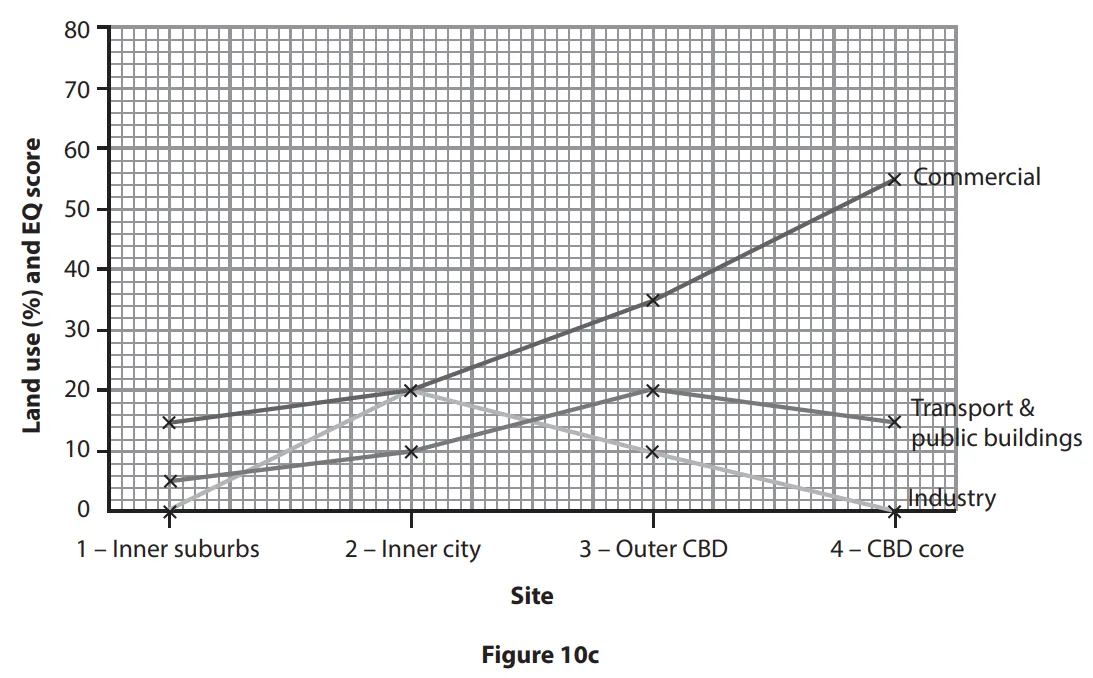
(ii) Justify the technique used in Figure 10c to represent the results shown in Figure 10b.
(iii) What conclusions can be reached from an analysis of Figures 10b and 10c?
(iv) Suggest additional information that might be collected to improve this investigation.

Ai এর মাধ্যমে

১০ লক্ষ+ প্রশ্ন ডাটাবেজ

প্র্যাকটিস এর মাধ্যমে নিজেকে তৈরি করে ফেলো
উত্তর দিবে তোমার বই থেকে ও তোমার মত করে।

সারা দেশের শিক্ষার্থীদের মধ্যে নিজের অবস্থান যাচাই
No related questions found

