চর্চাচর্চা
রেজিস্ট্রেশন
Chorcha
01605-002711
[email protected]
Moho, House No- 568, Road 1/A, Rajshahi 6207

Features

Mock Exam
Question Bank

Streams

SSC Science
HSC Science
HSC Arts
HSC Commerce
BCS/Job

Company

About
OurSchool
Affiliates
Help
FAQ

Legal

Terms & Conditions
Privacy Policy
Refund Policy
E-TIN NUMBER: 371617991290
Trade licence No: 03/B - 2673
Get it on Google PlayDownload on the app store

© 2026 Chorcha Tech Ltd. All rights reserved.

Institution management for schools — ourschool.io

Statistical Diagrams

1. This question has 2 part(s).

Specimen 2015 J560/06 6
1WRITTEN (3 pts)

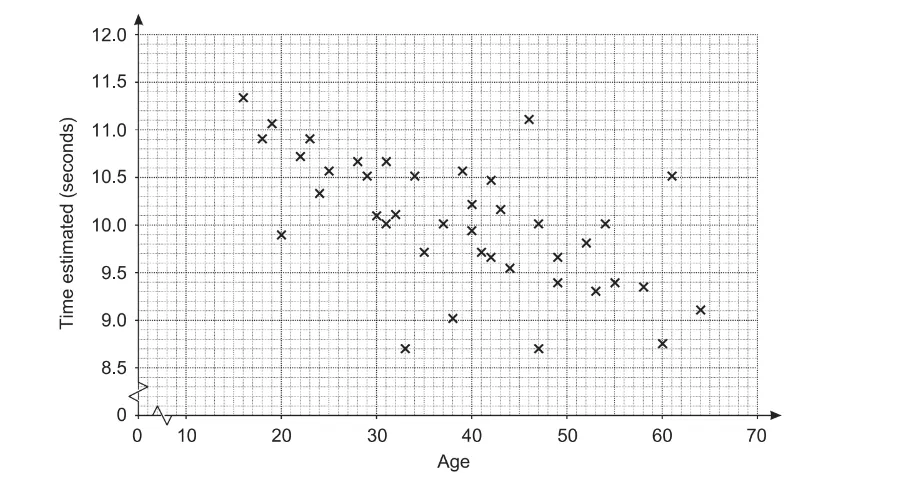
1.1. John wants to investigate whether men in the UK are better at estimating a time interval of 10 seconds than women in the UK. He decides to sample the population by asking his work colleagues to take the test.

The diagrams below summarise John’s results.
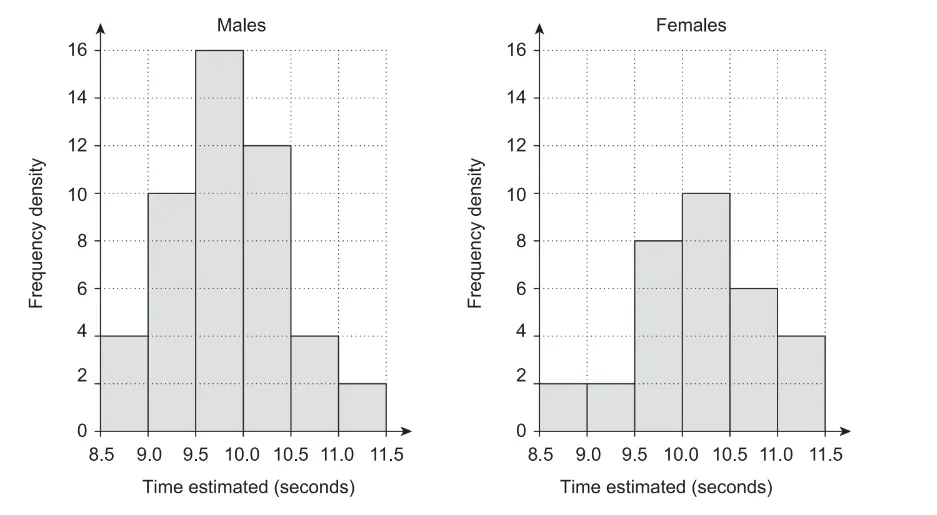
What information from the diagrams can be used to support each of these statements?

i) The older John’s colleagues are, the lower their estimate is.

[1]

ii) Males in the sample tend to underestimate the interval and females in the sample tend to overestimate the interval.

[2]

সংক্ষিপ্ত উত্তর প্রশ্ন
2WRITTEN (2 pts)

1.2. Comment on whether any conclusions can be drawn for the UK population from the results of this sample. 

সংক্ষিপ্ত উত্তর প্রশ্ন
Statistical Diagrams টপিকের ওপরে পরীক্ষা দাও
ai robot

তোমার যে কোন ডাউট সলভ করো চর্চা

Ai এর মাধ্যমে

Try চর্চা Ai
বিগত বছরসমূহের প্রশ্ন ব্যাংক

বিগত বছরসমূহের প্রশ্ন ব্যাংক

১০ লক্ষ+ প্রশ্ন ডাটাবেজ

আনলিমিটেড পরীক্ষা ও ব্যাখ্যা

আনলিমিটেড পরীক্ষা ও ব্যাখ্যা

প্র্যাকটিস এর মাধ্যমে নিজেকে তৈরি করে ফেলো

ডাউট সলভিং চর্চা AI

ডাউট সলভিং চর্চা AI

উত্তর দিবে তোমার বই থেকে ও তোমার মত করে।

সারা দেশব্যাপী লিডারবোর্ড

সারা দেশব্যাপী লিডারবোর্ড

সারা দেশের শিক্ষার্থীদের মধ্যে নিজের অবস্থান যাচাই

সবকিছু এক প্রিমিয়াম প্যাকেজে

Related question

No related questions found