Cumulative Frequency & Box Plots
1. This question has 2 part(s).
1.1. Sameena recorded the times, in minutes, some girls took to do a jigsaw puzzle.
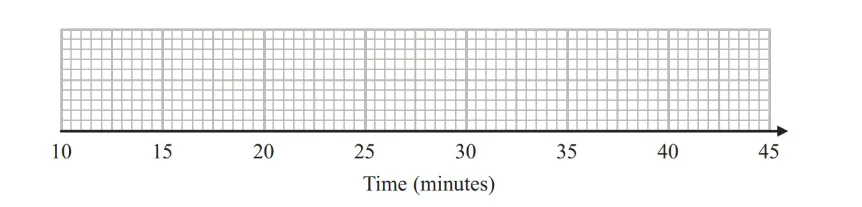
Sameena used her results to work out the information in this table.
Minutes | |
Shortest time | 18 |
Lower quartile | 25 |
Median | 29 |
Upper quartile | 33 |
Longest time | 44 |
On the grid, draw a box plot to show the information in the table.
1.2. The box plot below shows information about the times, in minutes, some boys took to do the same jigsaw puzzle.
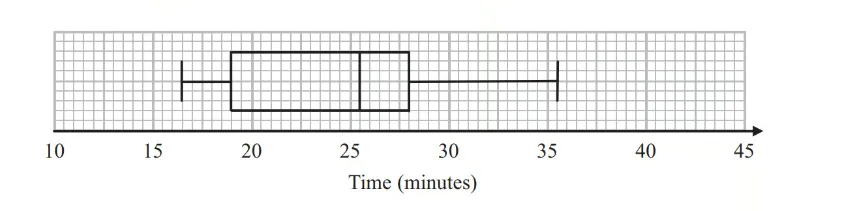
Compare the distributions of the girls' times and the boys' times.

Ai এর মাধ্যমে

১০ লক্ষ+ প্রশ্ন ডাটাবেজ

প্র্যাকটিস এর মাধ্যমে নিজেকে তৈরি করে ফেলো
উত্তর দিবে তোমার বই থেকে ও তোমার মত করে।

সারা দেশের শিক্ষার্থীদের মধ্যে নিজের অবস্থান যাচাই
No related questions found

