তাপগতীয় প্রক্রিয়া
Graph in figure shows the variation in density of a liquid substance with temperature. It can be seen that density of this substance is minimum at temperature . This liquid is used as a thermometer fluid in bulb of a thermometer and two such identical thermometers are used to measure temperature of two bodies A and B which are at temperature and . Now in an isolated system A and B are brought in contact so that they will be in thermal equilibrium. Which of the following statements is are correct?
Density of the substance in the thermometer varies with temperature as shown enfig
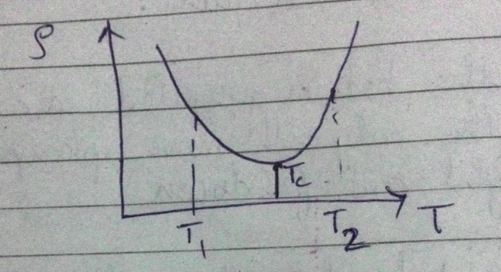
A has temp and has temp . Evidently .
Both are brought in contact in an isolated system, heat is transferred from the hot body to the cold body and the system attains an intermediate temperature iu between and . At this intermediate Lemp, the Density of the thermometer faid is lesser than initial so its volume should’ve in arand
‘
Ai এর মাধ্যমে
১০ লক্ষ+ প্রশ্ন ডাটাবেজ
প্র্যাকটিস এর মাধ্যমে নিজেকে তৈরি করে ফেলো
উত্তর দিবে তোমার বই থেকে ও তোমার মত করে।
সারা দেশের শিক্ষার্থীদের মধ্যে নিজের অবস্থান যাচাই