Analyzing Maps/Graphs/Charts
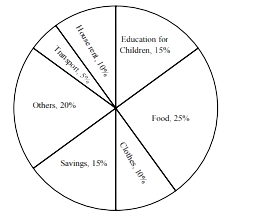
1. Look at the chart. It shows the distribution of percentages of a family's income into different categories. Now; analyze the chart in 150 words focusing the main aspects.
The distribution of the percentages of a family's income into different categories (%)
Ai এর মাধ্যমে
১০ লক্ষ+ প্রশ্ন ডাটাবেজ
প্র্যাকটিস এর মাধ্যমে নিজেকে তৈরি করে ফেলো
উত্তর দিবে তোমার বই থেকে ও তোমার মত করে।
সারা দেশের শিক্ষার্থীদের মধ্যে নিজের অবস্থান যাচাই