Graphs in Kinematics
1. Figure 1 shows a velocity-time graph for the motion of a particle travelling in a straight horizontal line. Velocity is measured in metres per second and time is measured in seconds.
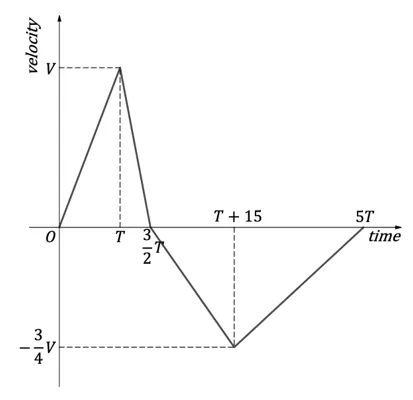
The particle has a final displacement of −27 m and its greatest magnitude of acceleration throughout the motion was .
Find the values of and , which are labelled in Figure 1.

Ai এর মাধ্যমে

১০ লক্ষ+ প্রশ্ন ডাটাবেজ

প্র্যাকটিস এর মাধ্যমে নিজেকে তৈরি করে ফেলো
উত্তর দিবে তোমার বই থেকে ও তোমার মত করে।

সারা দেশের শিক্ষার্থীদের মধ্যে নিজের অবস্থান যাচাই
No related questions found

