Urban & Rural Processes & Change in the UK
1. Many cities have high volumes of traffic. Study Figure 1.2 below.
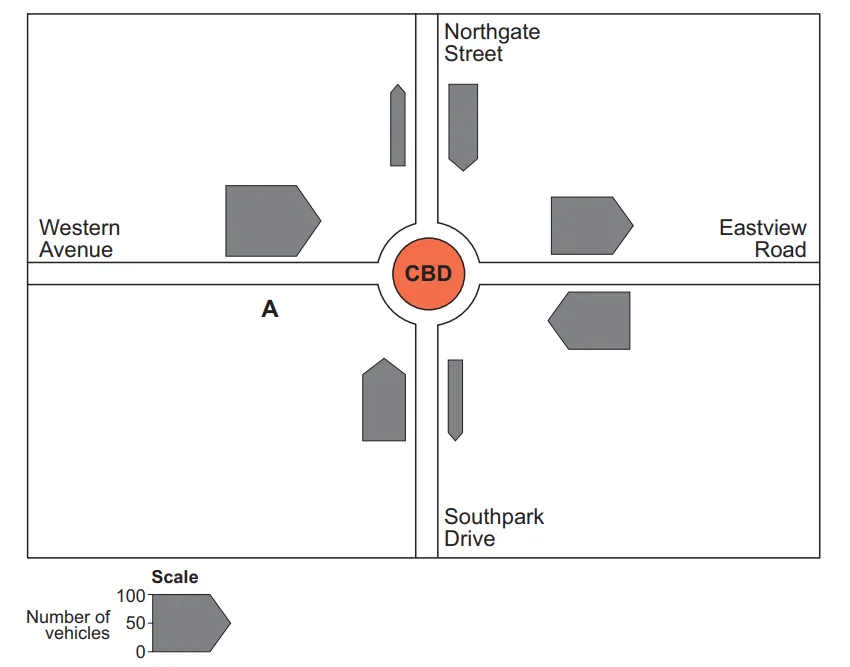
The amount of traffic flowing out of the CBD at Point A between 9.00am and 9.05am was 100 vehicles.
Which of the arrows in the table should be used to show the traffic at Point A on Figure 1.2? Tick (√) the correct box.

Ai এর মাধ্যমে

১০ লক্ষ+ প্রশ্ন ডাটাবেজ

প্র্যাকটিস এর মাধ্যমে নিজেকে তৈরি করে ফেলো
উত্তর দিবে তোমার বই থেকে ও তোমার মত করে।

সারা দেশের শিক্ষার্থীদের মধ্যে নিজের অবস্থান যাচাই
No related questions found

