Graphs in Kinematics
1. This question has 3 part(s).
1.1. Two drag-racing cars, and , start together from rest.
The instant each car reaches the finish line it releases a parachute and decelerates uniformly to rest.
Figure 1 shows the velocity–time graphs for the two cars from the start of the race until each comes to rest.
Velocity is measured in metres per second and time in seconds.
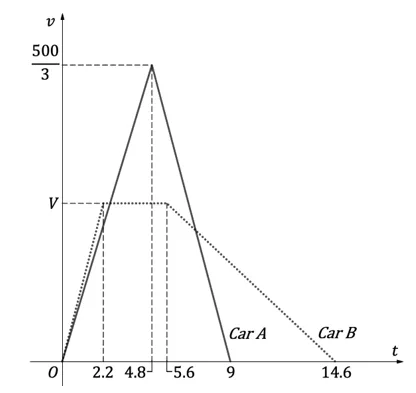
One of the cars was still accelerating when it crossed the finish line. Work out the magnitude of the acceleration for this car as it approaches the finish line.
1.2. The drag race track (strip) is 400 m long. Find the value of , which is indicated on Figure 1.
1.3. Hence show that half the distance covered by car was while decelerating.

Ai এর মাধ্যমে

১০ লক্ষ+ প্রশ্ন ডাটাবেজ

প্র্যাকটিস এর মাধ্যমে নিজেকে তৈরি করে ফেলো
উত্তর দিবে তোমার বই থেকে ও তোমার মত করে।

সারা দেশের শিক্ষার্থীদের মধ্যে নিজের অবস্থান যাচাই
No related questions found

