Scatter Graphs & Correlation
1. This question has 3 part(s).
1.1. The scatter graph shows some information about 10 cars, of the same type and make.
The graph shows the age (years) and the value (£) of each car.
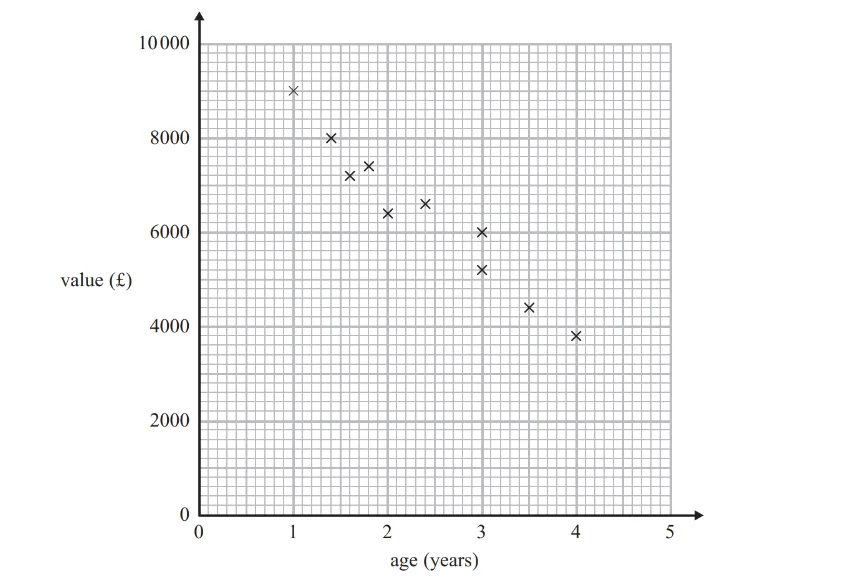
The table shows the age and the value of two other cars of the same type and make.
age(years) | 1 | 3.5 |
value(£) | 8200 | 5000 |
On the scatter graph, plot the information from the table.
1.2. Describe the relationship between the age and the value of the cars.
1.3. A car of the same type and make is years old.
Estimate the value of the car.

Ai এর মাধ্যমে

১০ লক্ষ+ প্রশ্ন ডাটাবেজ

প্র্যাকটিস এর মাধ্যমে নিজেকে তৈরি করে ফেলো
উত্তর দিবে তোমার বই থেকে ও তোমার মত করে।

সারা দেশের শিক্ষার্থীদের মধ্যে নিজের অবস্থান যাচাই
On the same day, in another British town, the maximum temperature was 16.4°c.
Estimate the number of hours of sunshine in this town on this day.
This question has 4 part(s).
This question has 4 part(s).
Liam has a best high jump of 166 cm
Use a line of best fit to estimate his best long jump.
...............................cm

