Data Presentation
1. This question has 3 part(s).
1.1. The grouped frequency table below contains information about the lengths of time of Susie’s calls with her customers. The table was used to draw the cumulative frequency curve also shown below.
Time (t minutes) | 4 < t ≤8 | 8 < t ≤ 12 | 12 < t ≤ 16 | 16 < t ≤20 |
Frequency | 16 | a | b | c |
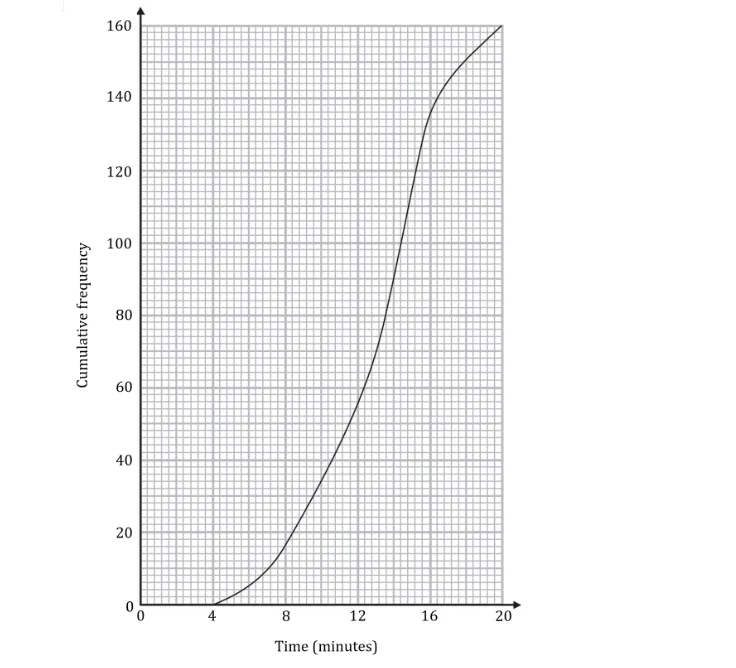
Use the graph to find the values of a, b and c.
1.2. Use the graph to calculate the interquartile range of times for Susie’s calls.
1.3. Use the graph to estimate the percentage of customers whose calls lasted longer than 10 minutes.

Ai এর মাধ্যমে

১০ লক্ষ+ প্রশ্ন ডাটাবেজ

প্র্যাকটিস এর মাধ্যমে নিজেকে তৈরি করে ফেলো
উত্তর দিবে তোমার বই থেকে ও তোমার মত করে।

সারা দেশের শিক্ষার্থীদের মধ্যে নিজের অবস্থান যাচাই
No related questions found

