Statistical Diagrams
1. This question has 3 part(s).
1.1. Kyung records the number of people in each of 24 cars on Wednesday.
His results are shown below.
i) Complete the frequency table.
You may use the tally column to help you.
Number in a car | Tally | Frequency |
1 | ||
2 | ||
3 | ||
4 | ||
5 | ||
6 |
[2]
ii) Write down the mode.
[1]
iii) Work out the range.
[1]
iv) Work out the median.
[1]
v) Calculate the mean.
[3]
vi) One of these cars is chosen at random.
Find the probability that the number of people in this car is 4.
[1]
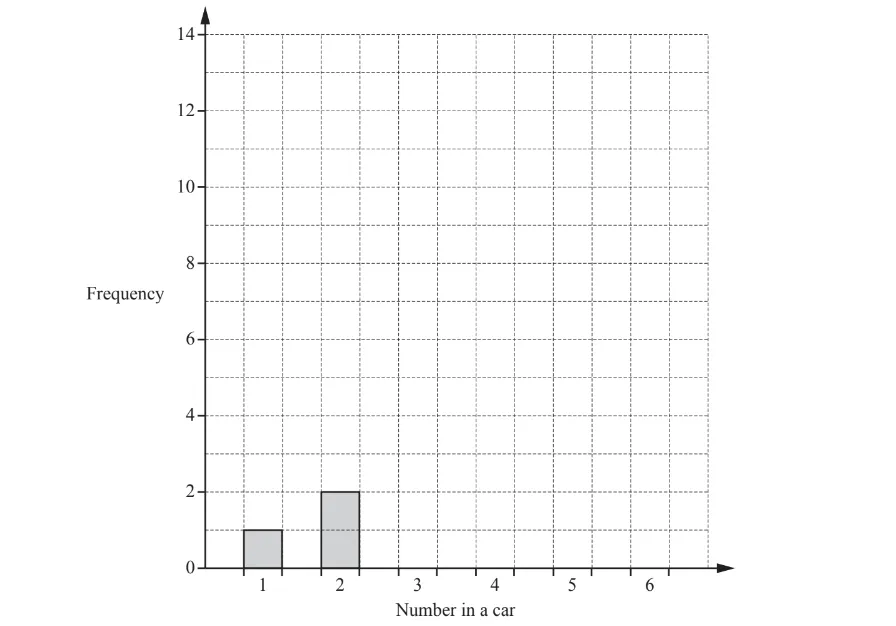
1.2. Kyung also records the number of people in each of 24 cars on Saturday. The table shows the results.
Number in a car | 1 | 2 | 3 | 4 | 5 | 6 |
Frequency | 1 | 2 | 5 | 13 | 2 | 1 |
On the grid, complete the bar chart to show these results.
1.3. Write down one comparison between the frequency tables in part (a)(i) and part (b).

Ai এর মাধ্যমে

১০ লক্ষ+ প্রশ্ন ডাটাবেজ

প্র্যাকটিস এর মাধ্যমে নিজেকে তৈরি করে ফেলো
উত্তর দিবে তোমার বই থেকে ও তোমার মত করে।

সারা দেশের শিক্ষার্থীদের মধ্যে নিজের অবস্থান যাচাই
No related questions found

