Climate & Natural Vegetation
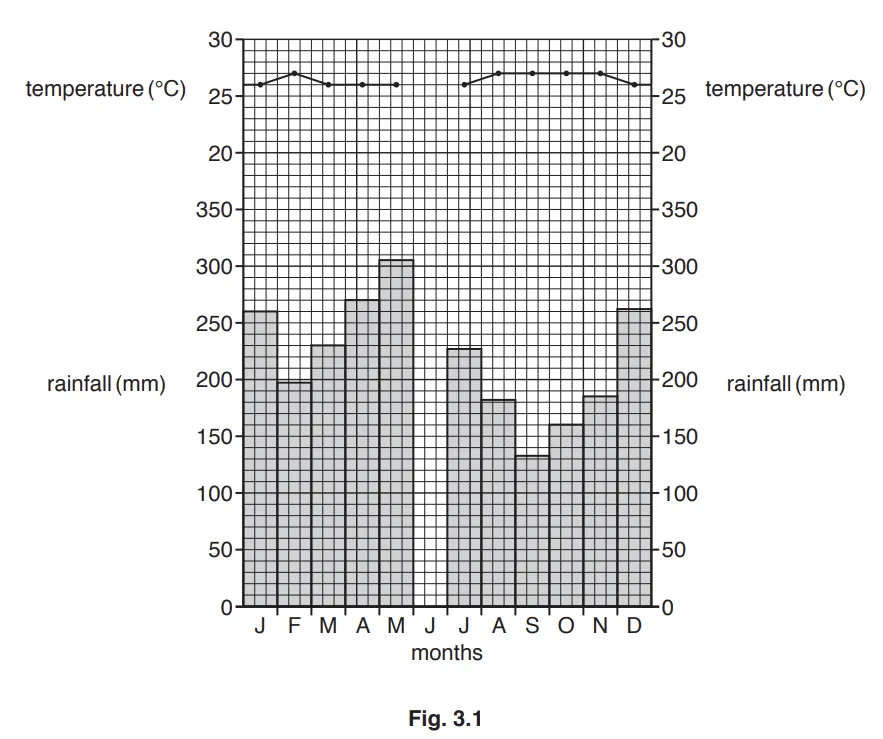
1. Fig. 3.1 shows the temperatures and rainfall of an area of equatorial climate.
(i)
The area shown on Fig. 3.1 has a temperature of 24°C and 250mm of rainfall in June. Plot this information on Fig. 3.1.
[1]
(ii)
Use the information in Fig. 3.1 to complete the table below.
Feature of the climate | Amount | Description |
mean temperature of the hottest month | .............°C | hot |
mean temperature of the coldest month | 24°C | ................... |
annual temperature range | 3°C | ................... |
[3]

Ai এর মাধ্যমে

১০ লক্ষ+ প্রশ্ন ডাটাবেজ

প্র্যাকটিস এর মাধ্যমে নিজেকে তৈরি করে ফেলো
উত্তর দিবে তোমার বই থেকে ও তোমার মত করে।

সারা দেশের শিক্ষার্থীদের মধ্যে নিজের অবস্থান যাচাই
No related questions found

