11. Analyzing maps / graphs / charts
1. The graph shows the engagement of child labour in different sectors of 'X' country from 2005 to 2016. Describe the graph in 150 words.
You should highlight the main features and summarize the information given in the graph.


Ai এর মাধ্যমে

১০ লক্ষ+ প্রশ্ন ডাটাবেজ

প্র্যাকটিস এর মাধ্যমে নিজেকে তৈরি করে ফেলো
উত্তর দিবে তোমার বই থেকে ও তোমার মত করে।

সারা দেশের শিক্ষার্থীদের মধ্যে নিজের অবস্থান যাচাই
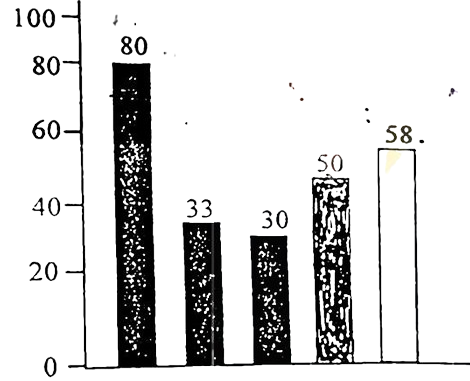
The graph below shows the importance and usage of English. Describe the graph in at least 80 words:
 (By serial)
Usage of English in information technology 80%
Usage of English as the 1st language 33%
Used in various organizations 30%
Used in other purposes 50%
Using English as the 2nd language 58%
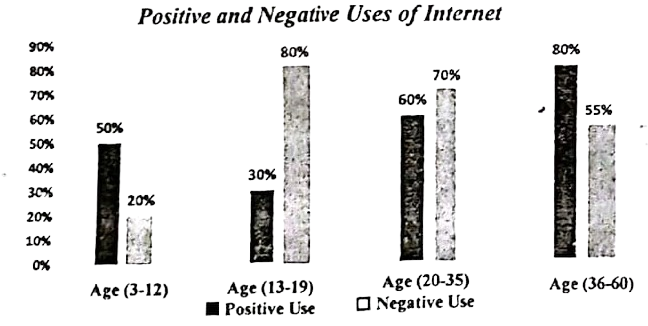
The graph below shows the positive and negative Uses of Internet according to different age groups of the users. Describe the chart at least in 150 words. You should highlight the information and report the main features given in the chart.
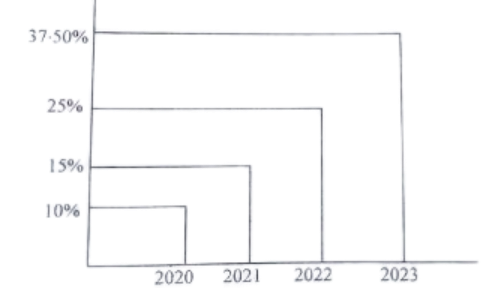
The graph below shows the users condition of the social sites of mobile phone in internet for the last four years. Now, describe the graph highlighting the information given in the chart.
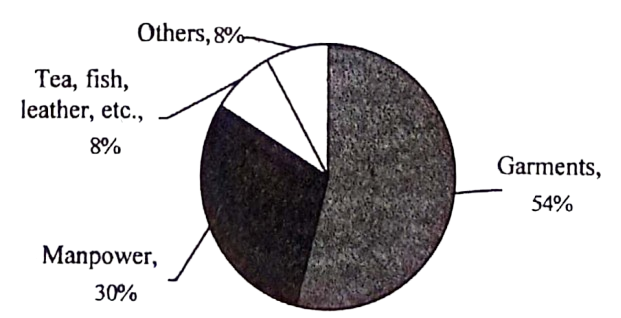
The following pie chart shows the export sectors in Bangladesh that earn foreign currency. Write an interpretation of the chart. (At least in 80 words).