11. Analyzing maps / graphs / charts
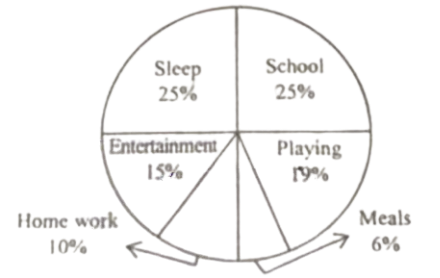
1. The pie chart below shows Rima's time spending on various activities. Describe the chart in at least 80 words.
Ai এর মাধ্যমে
১০ লক্ষ+ প্রশ্ন ডাটাবেজ
প্র্যাকটিস এর মাধ্যমে নিজেকে তৈরি করে ফেলো
উত্তর দিবে তোমার বই থেকে ও তোমার মত করে।
সারা দেশের শিক্ষার্থীদের মধ্যে নিজের অবস্থান যাচাই
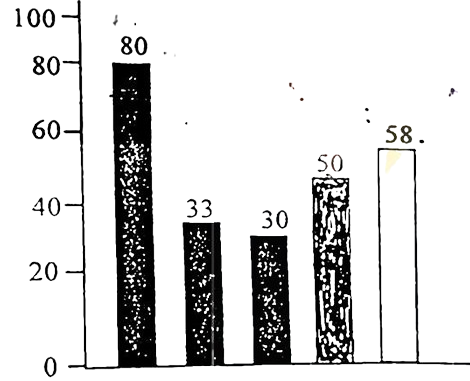
The graph below shows the importance and usage of English. Describe the graph in at least 80 words:
 (By serial)
Usage of English in information technology 80%
Usage of English as the 1st language 33%
Used in various organizations 30%
Used in other purposes 50%
Using English as the 2nd language 58%
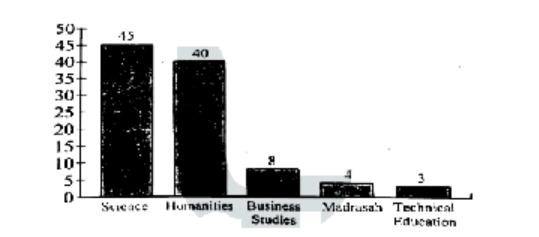
The graph below shows students from different academic areas who got themselves admitted into a public university last year. The left-aligned numbers show the percentages of students. You should analyse the information mentioning, the ratio of their achievements in at least 150 words.