Written Part
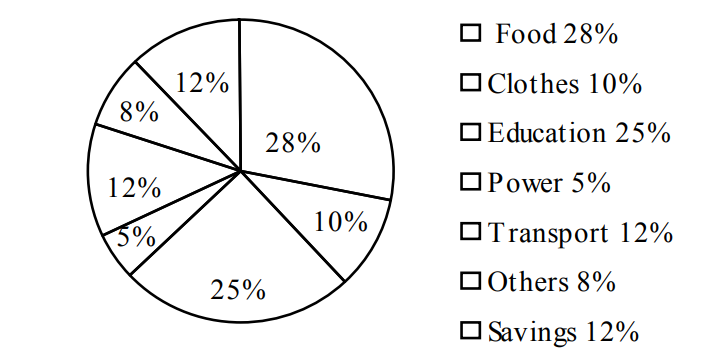
1. The pie-chart below shows the percentage of a family's household income distributed into different categories. Describe the pie-chart in 150 words:—
Ai এর মাধ্যমে
১০ লক্ষ+ প্রশ্ন ডাটাবেজ
প্র্যাকটিস এর মাধ্যমে নিজেকে তৈরি করে ফেলো
উত্তর দিবে তোমার বই থেকে ও তোমার মত করে।
সারা দেশের শিক্ষার্থীদের মধ্যে নিজের অবস্থান যাচাই
Fill in the gaps with appropriate propositions:
Social network is a network for virtual social interaction (a) —— Internet users across the world. Actually, this is an age (b)——— globalization. This is also an age of information and technology. People all over the world are virtually connected ( c) ———one another (d)——— the borders. Hence, the necessity of social networks has emerged. But the young generations are getting addicted(e) ——social networks (f) ——— Facebook, Twitter, Instagram etc. The lifestyle of the young before and after getting uses (g)——-a social network has a noticeable change, ln fact, the students who were used to studying at the table before, nowadays pass their valuable time by (h)—— the social media. As a result, they are now lagging (i)———So, they should he kept aloof (j)—-using internet excessively and unnecessarily
Write a paragraph on uses and abuses of internet in 200 words.