9. Transport in Animals
1. This question has 3 part(s).
1.1. A student monitored their pulse rate after exercise. The student’s pulse rate before exercise was 62 beats per minute.
The results are shown in Table 2.1.
Table 2.1
time after exercise /minutes | pulse rate /beats per minute |
|---|---|
0 | 156 |
1 | 108 |
2 | 78 |
3 | 66 |
4 | 62 |
5 | 62 |
(i) Plot a line graph on the grid of the data in Table 2.1. Include a line of best fit.

[4]
(ii) Describe the relationship shown in your graph, between pulse rate and time after exercise.
[2]
(iii) Calculate the percentage change in pulse rate from 0 minutes to 5 minutes using the data in Table 2.1.
Give your answer to two decimal places.
............................................................ % [3]
(iv) State the variable that was measured (dependent variable) in this investigation.
[1]
1.2. The student monitored their pulse rate after exercise on three separate days and calculated their average pulse rate from the data they collected.
The results are shown in Table 2.2.
Table 2.2
time after exercise /minutes | pulse rate /beats per minute | average pulse rate /beats per minute | ||
day 1 | day 2 | day 3 | ||
0 | 156 | 154 | 158 | 156 |
1 | 108 | 107 | 106 | 107 |
2 | 78 | 80 | 76 | 78 |
3 | 66 | 67 | 65 | 66 |
4 | 62 | 120 | 64 | 63 |
5 | 62 | 60 | 61 | 61 |
Explain why the student correctly calculated the average pulse rate at 4 minutes after exercise as 63 beats per minute rather than 82 beats per minute.
1.3. Fig. 2.1 shows a cross-section of an artery and a vein as seen using a light microscope.
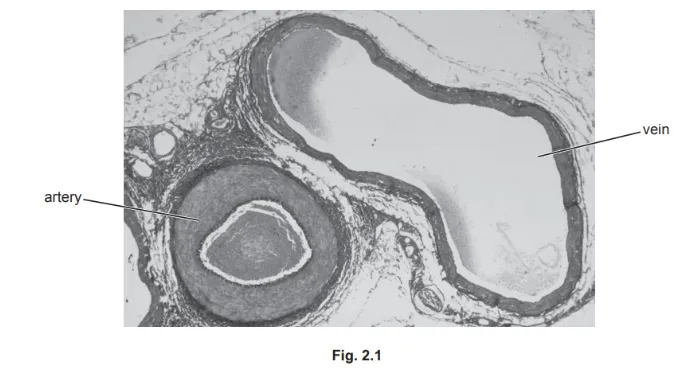
State one visible similarity and two visible differences between the artery and the vein shown in Fig. 2.1.

Ai এর মাধ্যমে

১০ লক্ষ+ প্রশ্ন ডাটাবেজ

প্র্যাকটিস এর মাধ্যমে নিজেকে তৈরি করে ফেলো
উত্তর দিবে তোমার বই থেকে ও তোমার মত করে।

সারা দেশের শিক্ষার্থীদের মধ্যে নিজের অবস্থান যাচাই
No related questions found

