Scatter Graphs & Correlation
1. This question has 4 part(s).
1.1. Mrs Salaman gives her class two mathematics tests.
The scatter diagram shows information about the marks each student scored.
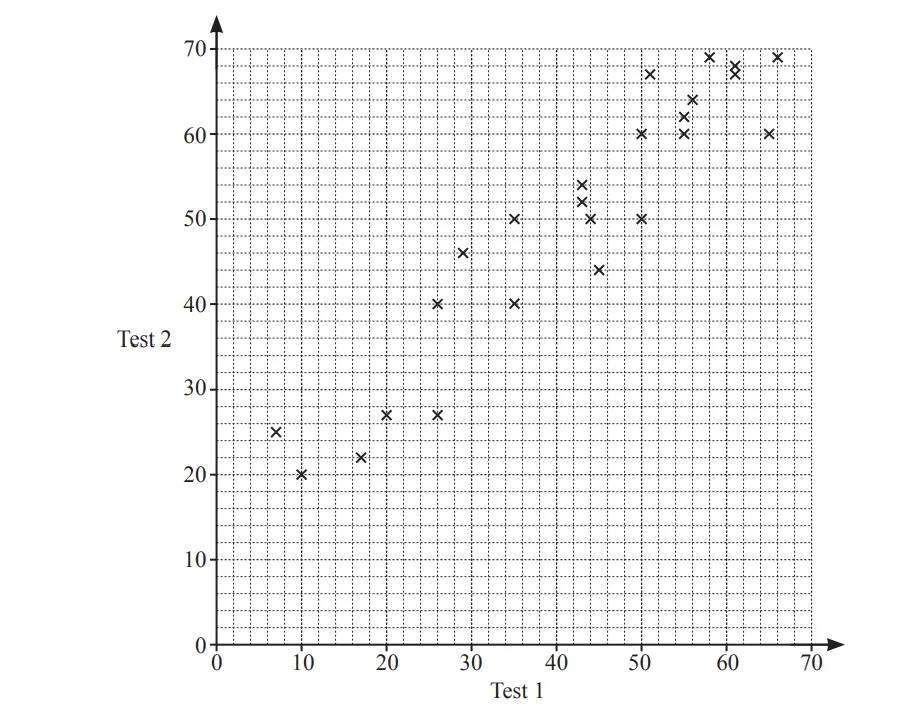
Write down the highest mark scored on test 1.
1.2. Write down the type of correlation shown in the scatter diagram.
1.3. Draw a line of best fit on the scatter diagram.
1.4. Hamish scored a mark of 40 on test 1.
He was absent for test 2.
Use your line of best fit to find an estimate for his mark on test 2.

Ai এর মাধ্যমে

১০ লক্ষ+ প্রশ্ন ডাটাবেজ

প্র্যাকটিস এর মাধ্যমে নিজেকে তৈরি করে ফেলো
উত্তর দিবে তোমার বই থেকে ও তোমার মত করে।

সারা দেশের শিক্ষার্থীদের মধ্যে নিজের অবস্থান যাচাই
No related questions found

